

Keltner Channels
Bands around an EMA, spaced by how far the market typically moves.
What it measures
Section titled “What it measures”An EMA of the closes, with bands atrMultiplier × ATR above and below. Using ATR rather than standard deviation makes the bands smoother than Bollinger Bands.
How traders read it
Section titled “How traders read it”Traders read closes outside the channel as a strong move, and use the channel’s slope for direction. Bollinger Bands inside the Keltner Channel is a common definition of a squeeze.
Formula
Section titled “Formula”middle = EMA(emaPeriods)lower = middle − atrMultiplier × ATR(atrPeriods)upper = middle + atrMultiplier × ATR(atrPeriods)Settings and output
Section titled “Settings and output”Call: keltnerChannels(emaPeriods, atrPeriods, atrMultiplier)
| Setting | Chart default |
|---|---|
emaPeriods: EMA Periods |
20 |
atrPeriods: ATR Periods |
10 |
atrMultiplier: ATR Multiplier |
2 |
What you get: a list of 3, in this order: 1. a number (“Keltner Channels”); 2. a number; 3. a number (“EMA”).
Warm-up: with keltnerChannels(20, 10, 2), it asks for 20 bars of history and a run-up of 40, and its first value came on bar 21 of the example data.
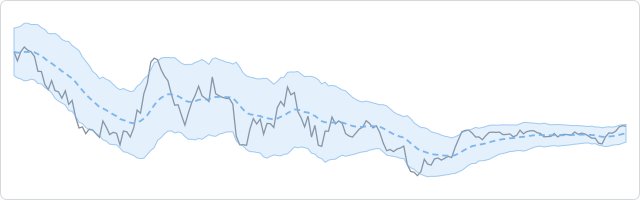
The prices are made up, hourly, and the same on every page, so the chart shows how the indicator behaves, not how a market behaved.
In an algorithm
Section titled “In an algorithm”function onIntervalClose() { const channel = keltnerChannels(20, 10, 2); if (OPEN_POSITIONS_COUNT === 0 && CLOSE > channel[1]) { openPosition("BUY", { quantity: 10000, stopLossPips: 30 }); }}