

Exponential Moving Average (EMA)
A moving average that reacts faster to the latest prices.
What it measures
Section titled “What it measures”An average in which each bar counts a little less than the one after it. It starts as the simple average of the first periods closes, then each new close pulls it a fixed fraction of the way.
How traders read it
Section titled “How traders read it”Read it like a simple moving average, but expect it to turn earlier and to be pulled about more by single bars. Many other indicators, such as MACD and Keltner Channels, are built from it.
Formula
Section titled “Formula”α = 2 / (periods + 1)EMA = EMA(previous bar) + α × (close − EMA(previous bar))The first value is the simple average of the first periods closes. Because every past close still has a little weight, it runs over twice periods bars before your start date so its value has settled.
Settings and output
Section titled “Settings and output”Call: ema(periods)
| Setting | Chart default |
|---|---|
periods: Periods |
20 |
What you get: a number.
Warm-up: with ema(20), it asks for 20 bars of history and a run-up of 40, and its first value came on bar 21 of the example data.
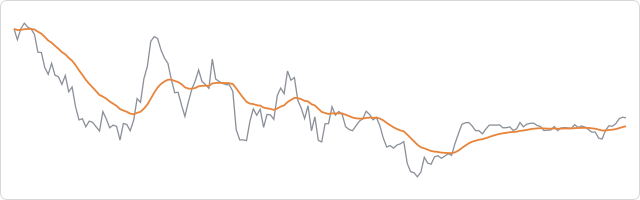
The prices are made up, hourly, and the same on every page, so the chart shows how the indicator behaves, not how a market behaved.
In an algorithm
Section titled “In an algorithm”function onIntervalClose() { const fast = ema(12); const slow = ema(26); log("EMA gap in pips", (fast - slow) / PIP_SIZE);}