

Simple Moving Average (SMA)
The average of the last few closes, redrawn at every bar.
What it measures
Section titled “What it measures”The mean of the last periods closes. Every bar in the window counts equally, so the line follows the price with a delay of about half the window.
How traders read it
Section titled “How traders read it”Traders use it to judge direction: price above a rising average reads as an uptrend, below a falling one as a downtrend. Two averages of different lengths crossing is a common entry rule, as in the moving average crossover guide. A longer window gives a smoother line that turns later.
Formula
Section titled “Formula”SMA = (close₁ + close₂ + … + closeₙ) / nwhere n is periods and close₁ is the bar that just closed.
Settings and output
Section titled “Settings and output”Call: sma(periods)
| Setting | Chart default |
|---|---|
periods: Periods |
20 |
What you get: a number.
Warm-up: with sma(20), it asks for 20 bars of history and a run-up of 1, and its first value came on bar 21 of the example data.
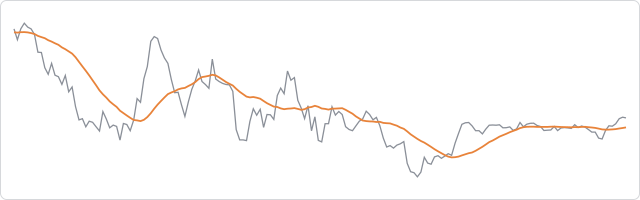
The prices are made up, hourly, and the same on every page, so the chart shows how the indicator behaves, not how a market behaved.
In an algorithm
Section titled “In an algorithm”function onIntervalClose() { if (OPEN_POSITIONS_COUNT === 0 && sma(20) > sma(50) && CLOSE > sma(20)) { openPosition("BUY", { quantity: 10000, stopLossPips: 25, takeProfitPips: 50 }); }}