

EMA Envelope
An exponential moving average with a band drawn a fixed percentage either side.
What it measures
Section titled “What it measures”How far the price has strayed from its exponential moving average, against a fixed percentage band. It turns sooner than the SMA Envelope because the EMA does.
How traders read it
Section titled “How traders read it”Read it like the SMA Envelope: closes outside the band are stretched from the average. Choose the width for the market and timeframe.
Formula
Section titled “Formula”middle = EMA(periods)lower = middle − middle × envelope / 100upper = middle + middle × envelope / 100Settings and output
Section titled “Settings and output”Call: emaEnvelope(periods, envelope)
| Setting | Chart default |
|---|---|
periods: Periods |
20 |
envelope: Envelope (%) |
none |
What you get: a list of 3, in this order: 1. a number; 2. a number; 3. a number.
Warm-up: with emaEnvelope(20, 0.2), it asks for 40 bars of history and a run-up of 40, and its first value came on bar 41 of the example data.
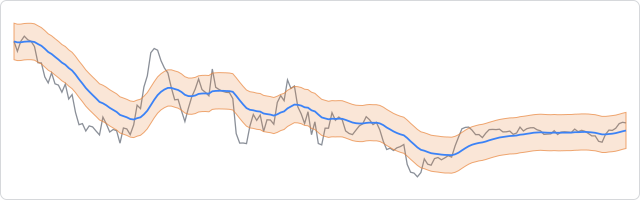
The prices are made up, hourly, and the same on every page, so the chart shows how the indicator behaves, not how a market behaved.
In an algorithm
Section titled “In an algorithm”function onIntervalClose() { const band = emaEnvelope(20, 0.2); log("Distance to upper band in pips", (band[1] - CLOSE) / PIP_SIZE);}envelope has no default: give it in every call. It must be above 0 and below 100.