

SMA Envelope
A simple moving average with a band drawn a fixed percentage either side.
What it measures
Section titled “What it measures”How far the price has strayed from its simple moving average, measured against a fixed percentage band.
How traders read it
Section titled “How traders read it”Traders read a close outside the band as stretched: in a range that suggests a move back toward the average, in a strong trend it shows the trend’s strength. The right width depends on the market and the timeframe; 0.2% suits hourly EUR/USD, a few percent suits daily stocks.
Formula
Section titled “Formula”middle = SMA(periods)lower = middle × (1 − envelope / 100)upper = middle × (1 + envelope / 100)Settings and output
Section titled “Settings and output”Call: smaEnvelope(periods, envelope)
| Setting | Chart default |
|---|---|
periods: Periods |
20 |
envelope: Envelope (%) |
none |
What you get: a list of 3, in this order: 1. a number; 2. a number; 3. a number (“sma”).
Warm-up: with smaEnvelope(20, 0.2), it asks for 20 bars of history and a run-up of 1, and its first value came on bar 21 of the example data.
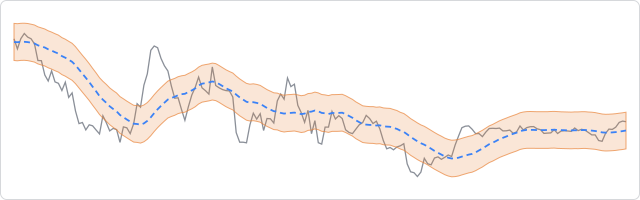
The prices are made up, hourly, and the same on every page, so the chart shows how the indicator behaves, not how a market behaved.
In an algorithm
Section titled “In an algorithm”function onIntervalClose() { const band = smaEnvelope(20, 0.2); if (OPEN_POSITIONS_COUNT === 0 && CLOSE < band[0]) { log("Close below the lower band"); }}envelope has no default: give it in every call.