

Bollinger Bands
Bands around a moving average that stretch when the market is busy and squeeze when it is quiet.
What it measures
Section titled “What it measures”The simple moving average of the closes, with bands deviations standard deviations above and below. The bands are wide when closes are spread out and narrow when they bunch together.
How traders read it
Section titled “How traders read it”Traders read a narrow “squeeze” as a quiet market that may break out, and closes outside the bands as stretched. In a strong trend the price can ride one band for a long time, so a touch is not a reversal signal on its own.
Formula
Section titled “Formula”middle = SMA(periods)σ = standard deviation of the last periods closes (population)lower = middle − deviations × σupper = middle + deviations × σSettings and output
Section titled “Settings and output”Call: bollinger(periods, deviations)
| Setting | Chart default |
|---|---|
periods: Periods |
20 |
deviations: Deviations |
2 |
What you get: a list of 3, in this order: 1. a number; 2. a number; 3. a number (“bollinger mid”).
Warm-up: with bollinger(20, 2), it asks for 20 bars of history and a run-up of 1, and its first value came on bar 21 of the example data.
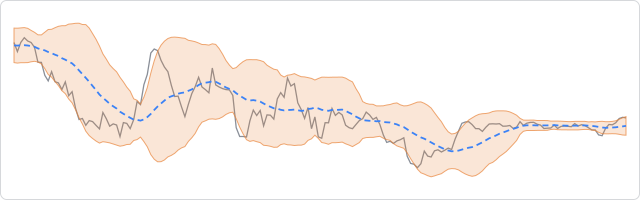
The prices are made up, hourly, and the same on every page, so the chart shows how the indicator behaves, not how a market behaved.
In an algorithm
Section titled “In an algorithm”function onIntervalClose() { const bands = bollinger(20, 2); const lower = bands[0]; const upper = bands[1]; if (OPEN_POSITIONS_COUNT === 0 && CLOSE < lower) { openPosition("BUY", { quantity: 10000, stopLossPips: 25, takeProfit: bands[2] }); } log("Band width in pips", (upper - lower) / PIP_SIZE);}