

Bollinger Bandwidth
How wide the Bollinger Bands are, as a percentage of the price.
What it measures
Section titled “What it measures”The distance between the upper and lower Bollinger Band, divided by the middle band.
How traders read it
Section titled “How traders read it”Traders watch for it to reach a low over recent history, the “squeeze”, as a sign that a quiet spell may end. It says nothing about which way the price will go.
Formula
Section titled “Formula”bandwidth = (upper − lower) / middle × 100 = 2 × deviations × σ / SMA × 100Settings and output
Section titled “Settings and output”Call: bollingerBandwidth(periods, deviations)
| Setting | Chart default |
|---|---|
periods: Periods |
20 |
deviations: Deviations |
2 |
What you get: a number.
Warm-up: with bollingerBandwidth(20, 2), it asks for 20 bars of history and a run-up of 1, and its first value came on bar 21 of the example data.
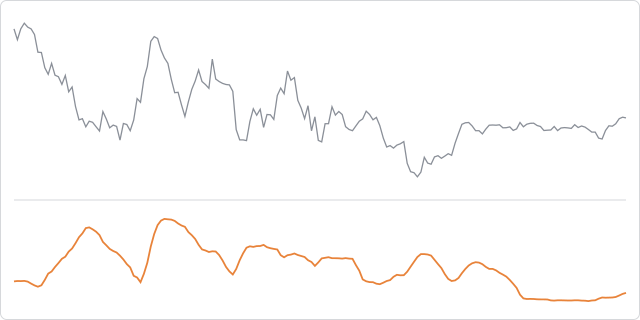
The prices are made up, hourly, and the same on every page, so the chart shows how the indicator behaves, not how a market behaved.
In an algorithm
Section titled “In an algorithm”function onIntervalClose() { if (bollingerBandwidth(20, 2) < 0.1) { log("Bands are squeezed"); }}