

Standard Deviation (Volatility)
How much the closes vary around their average, in pips.
What it measures
Section titled “What it measures”The population standard deviation of the last periods closes, divided by the pip size.
How traders read it
Section titled “How traders read it”Traders read a rising value as a market getting busier and a falling one as it calming down. It underlies Bollinger Bands.
Formula
Section titled “Formula”σ = √( Σ (close − mean)² / periods ), over the last periods closesvalue = σ / pip sizeBecause it is in pips, it suits currency pairs. For an instrument whose pip size is large compared with its price moves, the values are small.
Settings and output
Section titled “Settings and output”Call: standardDeviation(periods)
| Setting | Chart default |
|---|---|
periods: Periods |
10 |
What you get: a number.
Warm-up: with standardDeviation(10), it asks for 10 bars of history and a run-up of 1, and its first value came on bar 11 of the example data.
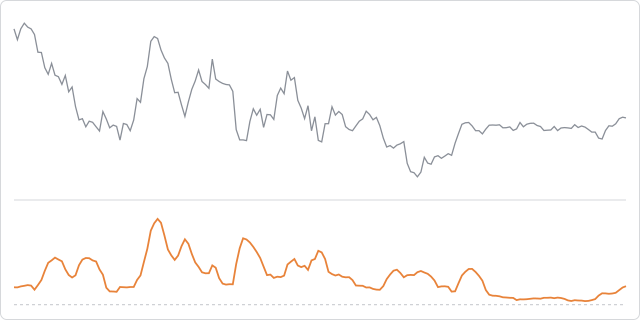
The prices are made up, hourly, and the same on every page, so the chart shows how the indicator behaves, not how a market behaved.
In an algorithm
Section titled “In an algorithm”function onIntervalClose() { if (standardDeviation(10) > 15 && OPEN_POSITIONS_COUNT === 0) { log("Busy market: standard deviation above 15 pips"); }}