

Average True Range (ATR)
How far the price typically moves in one bar.
What it measures
Section titled “What it measures”The true range of a bar is the largest of its high-to-low range and its distance from the previous close, so gaps count. ATR is a smoothed average of the true range, in price units.
How traders read it
Section titled “How traders read it”Traders use it to size stops and positions to the market: a stop of two ATRs is wider in a busy market and tighter in a quiet one. Rising ATR means bigger bars, not a direction.
Formula
Section titled “Formula”true range = the largest of high − low, |high − previous close|, |low − previous close|first ATR = average of the first periods true rangesATR = (ATR(previous bar) × (periods − 1) + true range) / periodsThis is Wilder’s smoothing. Some platforms smooth with an EMA instead, which gives slightly different values.
Settings and output
Section titled “Settings and output”Call: atr(periods)
| Setting | Chart default |
|---|---|
periods: Periods |
14 |
What you get: a number.
Warm-up: with atr(14), it asks for 0 bars of history and a run-up of 28, and its first value came on bar 15 of the example data.
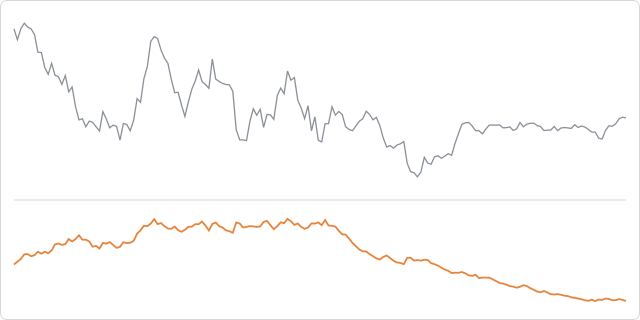
The prices are made up, hourly, and the same on every page, so the chart shows how the indicator behaves, not how a market behaved.
In an algorithm
Section titled “In an algorithm”function onIntervalClose() { const stopPips = Math.round((2 * atr(14)) / PIP_SIZE); if (OPEN_POSITIONS_COUNT === 0 && CLOSE > sma(50)) { openPosition("BUY", { quantity: 10000, stopLossPips: stopPips }); }}