

Bollinger %B
Where the close sits between the Bollinger Bands, as one number.
What it measures
Section titled “What it measures”The close’s position between the lower and upper Bollinger Band: 0 at the lower band, 1 at the upper, below 0 or above 1 outside them.
How traders read it
Section titled “How traders read it”Traders use it to turn “touching the band” into a number they can test, for example %B below 0 as stretched to the downside.
Formula
Section titled “Formula”%B = (close − lower band) / (upper band − lower band)When the bands meet, on a window where the price did not move, there is no %B and the bar has no value.
Settings and output
Section titled “Settings and output”Call: bollingerB(periods, deviations)
| Setting | Chart default |
|---|---|
periods: Periods |
20 |
deviations: Deviations |
2 |
What you get: a number.
Warm-up: with bollingerB(20, 2), it asks for 20 bars of history and a run-up of 1, and its first value came on bar 21 of the example data.
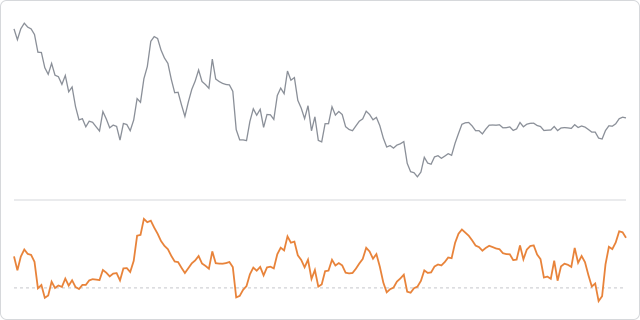
The prices are made up, hourly, and the same on every page, so the chart shows how the indicator behaves, not how a market behaved.
In an algorithm
Section titled “In an algorithm”function onIntervalClose() { const percentB = bollingerB(20, 2); if (OPEN_POSITIONS_COUNT === 0 && percentB < 0) { openPosition("BUY", { quantity: 10000, stopLossPips: 25, takeProfitPips: 40 }); }}This sample buys when the close is below the lower band.