

Supertrend
One line that sits below price in a rise and above it in a fall, and only ever moves in the trend’s favour.
What it measures
Section titled “What it measures”Supertrend puts a band multiplier × ATR above and below the middle of each bar. In a rise it shows the lower band, which can rise but not fall; in a fall, the upper band, which can fall but not rise. When the close goes through the band, the trend flips and the other band takes over.
How traders read it
Section titled “How traders read it”Traders use the line as a trailing stop and its side of price as the trend: hold longs while it is below the close and shorts while it is above. A larger multiplier flips less often and gives back more before it does.
Formula
Section titled “Formula”middle = (HIGH + LOW) / 2basic upper = middle + multiplier × ATR(periods)basic lower = middle − multiplier × ATR(periods)upper = basic upper if it is lower than the previous upper, or the previous close was above the previous upper; else the previous upperlower = basic lower if it is higher than the previous lower, or the previous close was below the previous lower; else the previous lowerSupertrend = lower in a rise, upper in a fallThe ATR is Wilder’s. The first trend is a fall, as TradingView’s ta.supertrend starts.
Settings and output
Section titled “Settings and output”Call: supertrend(periods, multiplier)
| Setting | Chart default |
|---|---|
periods: ATR Periods |
10 |
multiplier: Multiplier |
3 |
What you get: a number.
Warm-up: with supertrend(10, 3), it asks for 0 bars of history and a run-up of 40, and its first value came on bar 11 of the example data.
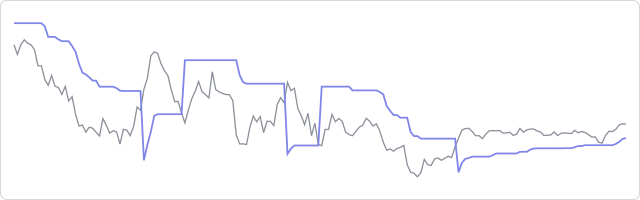
The prices are made up, hourly, and the same on every page, so the chart shows how the indicator behaves, not how a market behaved.
In an algorithm
Section titled “In an algorithm”function onIntervalClose() { const line = supertrend(10, 3); if (line !== null && line < CLOSE && OPEN_POSITIONS_COUNT === 0) { openPosition("BUY", { quantity: 10000, stopLossPips: 30 }); }}