

Parabolic SAR
A trailing stop that closes in on price as the trend runs, and jumps to the other side when price touches it.
What it measures
Section titled “What it measures”In a rise the SAR sits below price and moves up each bar by a fraction of the distance to the highest high so far. The fraction, the acceleration factor, starts at step and grows by step each time the rise makes a new high, up to maximum, so the stop tightens faster the longer the trend runs. A fall is the mirror image. When a bar’s low reaches the SAR of a rise, or its high the SAR of a fall, the trend reverses.
How traders read it
Section titled “How traders read it”Traders treat the SAR as a stop: hold a long while price stays above it, and exit or reverse when it flips. In a sideways market it flips back and forth, so it is usually paired with a trend filter such as the Average Directional Index.
Formula
Section titled “Formula”next SAR = SAR + AF × (EP − SAR)EP = highest high of the rise, or lowest low of the fallAF = step, rising by step at each new EP, up to maximumin a rise, SAR is no higher than this bar's or the previous bar's lowin a fall, SAR is no lower than this bar's or the previous bar's highon a reversal, SAR = the old EP, EP = this bar's extreme, AF = stepThis follows TA-Lib’s SAR. The first two bars decide the first trend, and the value on each bar is the SAR that applied during it. On charts it draws as a dotted line, which jumps at each reversal.
Settings and output
Section titled “Settings and output”Call: parabolicSar(step, maximum)
| Setting | Chart default |
|---|---|
step: Step |
0.02 |
maximum: Maximum |
0.2 |
What you get: a number.
Warm-up: with parabolicSar(0.02, 0.2), it asks for 0 bars of history and a run-up of 100, and its first value came on bar 2 of the example data.
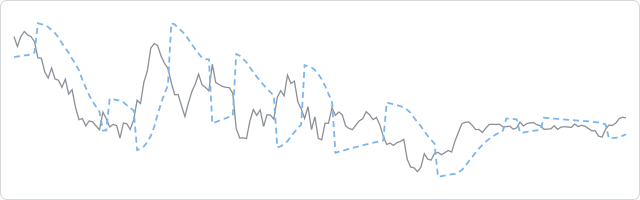
The prices are made up, hourly, and the same on every page, so the chart shows how the indicator behaves, not how a market behaved.
In an algorithm
Section titled “In an algorithm”function onIntervalClose() { const stop = parabolicSar(0.02, 0.2); if (stop !== null && stop < CLOSE && OPEN_POSITIONS_COUNT === 0) { openPosition("BUY", { quantity: 10000, stopLossPips: 30 }); }}