

Average Directional Index
How strong the trend is, whichever way it runs, with two lines for its direction.
What it measures
Section titled “What it measures”+DI and −DI compare how far each bar pushed above the previous high with how far it pushed below the previous low, as a share of the Average True Range. ADX smooths the gap between them, so it rises when one side dominates and falls when they balance. It says nothing about direction on its own: a strong fall lifts it as much as a strong rise.
How traders read it
Section titled “How traders read it”Traders read ADX above about 25 as a trending market and below about 20 as a ranging one, and use it to choose between trend-following and range rules. In Wilder’s own system, +DI crossing above −DI is a buy signal and crossing below a sell, taken only when ADX is high enough.
Formula
Section titled “Formula”+DM = HIGH − previous HIGH, if that is positive and larger than previous LOW − LOW; else 0−DM = previous LOW − LOW, if that is positive and larger than HIGH − previous HIGH; else 0+DI = 100 × Wilder(+DM, periods) / Wilder(true range, periods)−DI = 100 × Wilder(−DM, periods) / Wilder(true range, periods)DX = 100 × |+DI − −DI| / (+DI + −DI)ADX = Wilder(DX, periods)Wilder’s average starts from the mean of the first periods values, then takes (previous × (periods − 1) + value) / periods. With no movement at all, the DIs and ADX are 0.
Settings and output
Section titled “Settings and output”Call: adx(periods)
| Setting | Chart default |
|---|---|
periods: Periods |
14 |
What you get: a list of 3, in this order: 1. a number (“ADX”); 2. a number (“+DI”); 3. a number (“−DI”).
Warm-up: with adx(14), it asks for 0 bars of history and a run-up of 56, and its first value came on bar 28 of the example data.
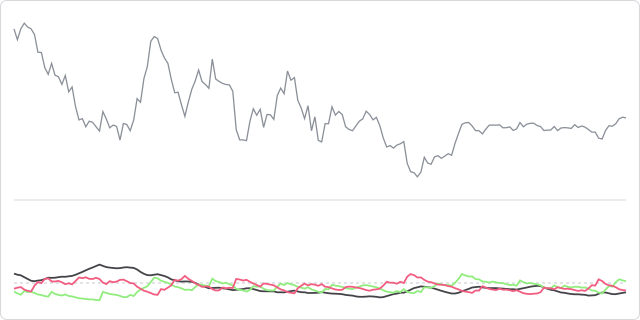
The prices are made up, hourly, and the same on every page, so the chart shows how the indicator behaves, not how a market behaved.
In an algorithm
Section titled “In an algorithm”function onIntervalClose() { const [strength, plusDI, minusDI] = adx(14); if (strength !== null && strength > 25 && plusDI > minusDI && OPEN_POSITIONS_COUNT === 0) { openPosition("BUY", { quantity: 10000, stopLossPips: 30 }); }}