

Relative Strength Index (RSI)
How strongly the recent closes have risen against how strongly they have fallen, from 0 to 100.
What it measures
Section titled “What it measures”RSI compares the average size of up closes with the average size of down closes. 100 means every recent change was a gain, 0 means every one was a loss, and 50 means they balanced.
How traders read it
Section titled “How traders read it”Traders treat readings above 70 as overbought and below 30 as oversold, and the chart draws those lines. In a strong trend RSI can stay above 70 or below 30 for a long time, so many traders use the crossing back through the line, or a divergence from the price, rather than the reading itself.
Formula
Section titled “Formula”change = close − previous closeaverage gain, average loss = averages of the first periods gains and lossesthen, each bar: average = (average(previous bar) × (periods − 1) + this bar's gain or loss) / periodsRS = average gain / average lossRSI = 100 − 100 / (1 + RS) (100 when there were no losses, 0 when there was no movement)This is Wilder’s smoothing. The first change is measured from the close of the bar before the run starts, so the first value comes after periods changes.
Settings and output
Section titled “Settings and output”Call: rsi(periods)
| Setting | Chart default |
|---|---|
periods: Periods |
14 |
What you get: a number.
Warm-up: with rsi(14), it asks for 0 bars of history and a run-up of 29, and its first value came on bar 15 of the example data.
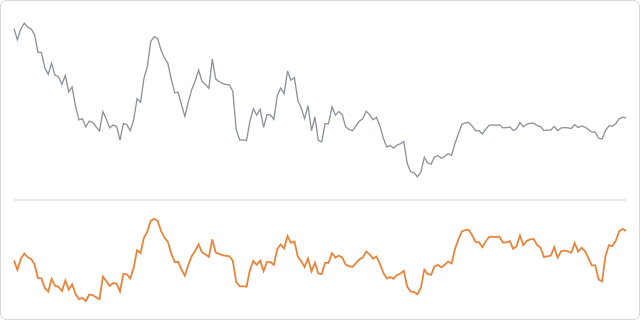
The prices are made up, hourly, and the same on every page, so the chart shows how the indicator behaves, not how a market behaved.
In an algorithm
Section titled “In an algorithm”function onIntervalClose() { const value = rsi(14); if (OPEN_POSITIONS_COUNT === 0 && value < 30) { openPosition("BUY", { quantity: 10000, stopLossPips: 25, takeProfitPips: 40 }); } if (OPEN_POSITIONS_COUNT > 0 && value > 70) { closeAllPositions(); }}