

StochRSI
Where RSI sits within its own recent range, from 0 to 1.
What it measures
Section titled “What it measures”StochRSI takes the last periods values of RSI and gives the latest one’s position between their lowest and highest. It moves faster than RSI and reaches its extremes far more often.
How traders read it
Section titled “How traders read it”Traders read above 0.8 as overbought and below 0.2 as oversold. Because it is so quick, it is usually combined with a trend filter rather than traded alone.
Formula
Section titled “Formula”StochRSI = (RSI − lowest RSI of the window) / (highest RSI of the window − lowest RSI of the window)RSI uses the same periods.
Settings and output
Section titled “Settings and output”Call: stochRsi(periods)
| Setting | Chart default |
|---|---|
periods: Periods |
14 |
What you get: a number.
Warm-up: with stochRsi(14), it asks for 0 bars of history and a run-up of 43, and its first value came on bar 28 of the example data.
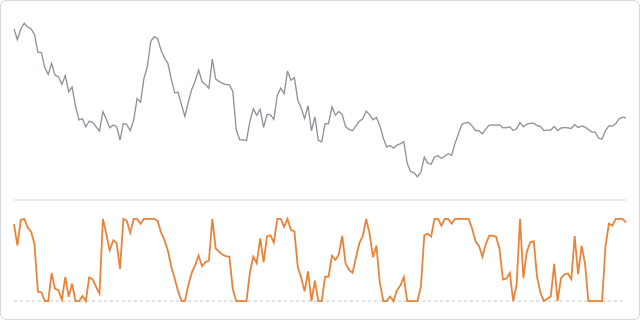
The prices are made up, hourly, and the same on every page, so the chart shows how the indicator behaves, not how a market behaved.
In an algorithm
Section titled “In an algorithm”function onIntervalClose() { if (OPEN_POSITIONS_COUNT === 0 && CLOSE > sma(50) && stochRsi(14) < 0.2) { openPosition("BUY", { quantity: 10000, stopLossPips: 25, takeProfitPips: 40 }); }}If RSI has not moved at all across the window, the range is zero and the value is not a number.