

Money Flow Index (MFI)
The share of recent volume that went with rising bars, from 0 to 100.
What it measures
Section titled “What it measures”Each bar’s money flow is its typical price, (high + low + close) / 3, times its volume. MFI is the share of the window’s money flow that came from up bars, scaled like RSI. A bar counts as up when its typical price is above the previous bar’s, and as down when it is below; an unchanged bar counts on neither side. Volume here is the volume the price feed reports for each bar. For forex, brokers usually report the number of price updates in the bar, not an amount traded, so read it as activity rather than money.
How traders read it
Section titled “How traders read it”Traders read above 80 as overbought and below 20 as oversold, and the chart draws those lines.
Formula
Section titled “Formula”typical price = (high + low + close) / 3money flow = typical price × volumepositive flow = sum over the window of money flow on bars whose typical price rosenegative flow = sum over the window of money flow on bars whose typical price fellMFI = 100 − 100 / (1 + positive flow / negative flow)A window with only positive flow gives 100, and one with no flow at all gives 0.
Settings and output
Section titled “Settings and output”Call: mfi(emaPeriods)
| Setting | Chart default |
|---|---|
emaPeriods: Periods |
14 |
What you get: a number.
Warm-up: with mfi(14), it asks for 0 bars of history and a run-up of 15, and its first value came on bar 15 of the example data.
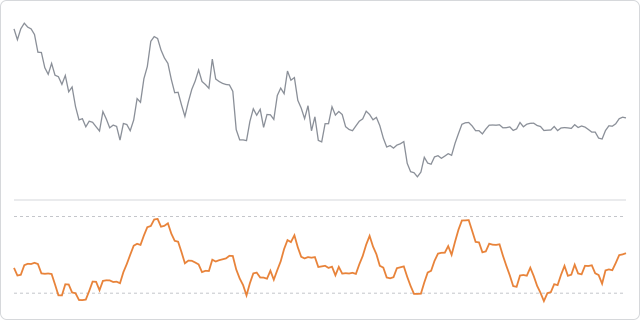
The prices are made up, hourly, and the same on every page, so the chart shows how the indicator behaves, not how a market behaved.
In an algorithm
Section titled “In an algorithm”function onIntervalClose() { const value = mfi(14); if (OPEN_POSITIONS_COUNT === 0 && value < 20) { openPosition("BUY", { quantity: 10000, stopLossPips: 25, takeProfitPips: 40 }); }}