

Chande Momentum Oscillator (CMO)
The balance of up moves against down moves, from −100 (all down) to +100 (all up).
What it measures
Section titled “What it measures”CMO sums the gains and the losses of the last periods bars and compares the difference with the total. Unlike RSI it is not smoothed, so it reacts at once when a large move leaves the window. With signalPeriods, an exponential moving average of CMO is added.
How traders read it
Section titled “How traders read it”Traders read above +50 as overbought and below −50 as oversold, and a cross of zero or of the signal line as a turn.
Formula
Section titled “Formula”change = close − previous closeCMO = 100 × (sum of changes) / (sum of |changes|), over the last periods changessignal = EMA(CMO, signalPeriods)A window with no movement at all gives 0.
Settings and output
Section titled “Settings and output”Call: cmo(periods, signalPeriods)
| Setting | Chart default |
|---|---|
periods: Periods |
14 |
signalPeriods: Signal Periods |
9 |
What you get: a list of 2, in this order: 1. a number; 2. a number (“cmo Signal”).
Warm-up: with cmo(14, 9), it asks for 0 bars of history and a run-up of 24, and its first value came on bar 23 of the example data.
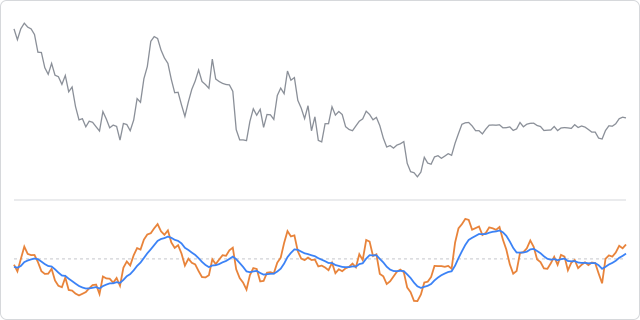
The prices are made up, hourly, and the same on every page, so the chart shows how the indicator behaves, not how a market behaved.
In an algorithm
Section titled “In an algorithm”function onIntervalClose() { const lines = cmo(14, 9); if (OPEN_POSITIONS_COUNT === 0 && lines[0] > lines[1] && lines[0] < -50) { openPosition("BUY", { quantity: 10000, stopLossPips: 25, takeProfitPips: 40 }); }}Without signalPeriods, cmo(14) gives a single number.