

Rate of Change (ROC)
How much the price has changed, in percent, over the last few bars.
What it measures
Section titled “What it measures”ROC compares the close with the close periods bars ago. It is positive when the price is higher than it was, and its size shows how fast it has moved.
How traders read it
Section titled “How traders read it”Traders use a cross of zero as a change of direction, and extreme readings, judged against the instrument’s own history, as a stretched move.
Formula
Section titled “Formula”ROC = (close − close periods bars ago) / close periods bars ago × 100Settings and output
Section titled “Settings and output”Call: roc(periods)
| Setting | Chart default |
|---|---|
periods: Periods |
12 |
What you get: a number.
Warm-up: with roc(12), it asks for 13 bars of history and a run-up of 1, and its first value came on bar 14 of the example data.
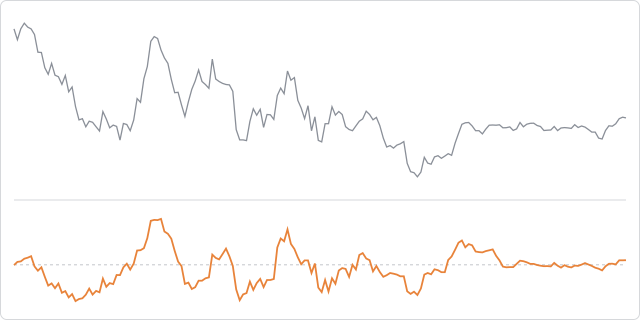
The prices are made up, hourly, and the same on every page, so the chart shows how the indicator behaves, not how a market behaved.
In an algorithm
Section titled “In an algorithm”function onIntervalClose() { if (OPEN_POSITIONS_COUNT === 0 && roc(12) > 0.2 && CLOSE > sma(50)) { openPosition("BUY", { quantity: 10000, stopLossPips: 25, takeProfitPips: 50 }); }}