

Know Sure Thing (KST)
Momentum over four time spans at once, weighted towards the longest.
What it measures
Section titled “What it measures”KST takes four rates of change over increasing windows, smooths each with a simple moving average, and adds them with weights 1, 2, 3 and 4. With signalSMA, a simple moving average of KST is added as a signal line.
How traders read it
Section titled “How traders read it”Traders read KST crossing its signal line or zero as a change in the broader trend. Because it blends four spans, it turns more slowly than a single ROC.
Formula
Section titled “Formula”RCMA1 = SMA(ROC(first ROC periods), first SMA periods), and likewise RCMA2 to RCMA4KST = RCMA1 × 1 + RCMA2 × 2 + RCMA3 × 3 + RCMA4 × 4signal = SMA(KST, signalSMA)Each ROC window must be longer than the one before.
Settings and output
Section titled “Settings and output”Call: kst(firstROCPeriods, secondROCPeriods, thirdROCPeriods, fourthROCPeriods, firstSMAPeriods, secondSMAPeriods, thirdSMAPeriods, fourthSMAPeriods, signalSMA)
| Setting | Chart default |
|---|---|
firstROCPeriods: First ROC Periods |
10 |
secondROCPeriods: Second ROC Periods |
15 |
thirdROCPeriods: Third ROC Periods |
20 |
fourthROCPeriods: Fourth ROC Periods |
30 |
firstSMAPeriods: First SMA Periods |
10 |
secondSMAPeriods: Second SMA Periods |
10 |
thirdSMAPeriods: Third SMA Periods |
10 |
fourthSMAPeriods: Fourth SMA Periods |
15 |
signalSMA: Signal SMA Periods |
9 |
What you get: a list of 2, in this order: 1. a number (“KST”); 2. a number (“KST Signal Line”).
Warm-up: with kst(10, 15, 20, 30, 10, 10, 10, 15, 9), it asks for 31 bars of history and a run-up of 24, and its first value came on bar 54 of the example data.
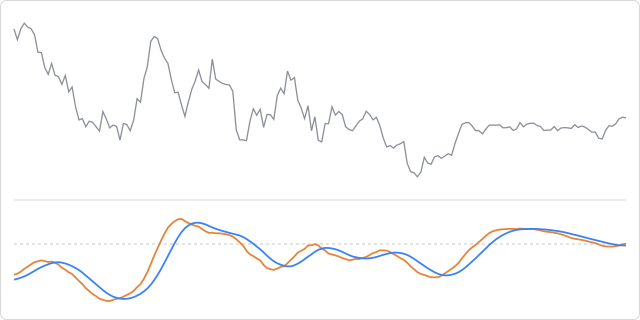
The prices are made up, hourly, and the same on every page, so the chart shows how the indicator behaves, not how a market behaved.
In an algorithm
Section titled “In an algorithm”function onIntervalClose() { const lines = kst(10, 15, 20, 30, 10, 10, 10, 15, 9); if (OPEN_POSITIONS_COUNT === 0 && lines[0] > lines[1] && lines[0] > 0) { openPosition("BUY", { quantity: 10000, stopLossPips: 30, takeProfitPips: 60 }); }}Without signalSMA, the eight-setting form gives a single number.