

Coppock Curve
A slow momentum line built to show when a long fall turns.
What it measures
Section titled “What it measures”Coppock is a weighted moving average of the sum of two rates of change, one longer and one shorter.
How traders read it
Section titled “How traders read it”Traders, originally on monthly index charts, read a turn up from below zero as the start of a recovery. On hourly bars it is just a smoothed momentum line.
Formula
Section titled “Formula”Coppock = WMA(ROC(firstRoCPeriods) + ROC(secondRoCPeriods), wmaPeriods)Settings and output
Section titled “Settings and output”Call: coppock(firstRoCPeriods, wmaPeriods, secondRoCPeriods)
| Setting | Chart default |
|---|---|
firstRoCPeriods: First ROC Periods |
14 |
wmaPeriods: WMA Periods |
10 |
secondRoCPeriods: Second ROC Periods |
11 |
What you get: a number.
Warm-up: with coppock(14, 10, 11), it asks for 15 bars of history and a run-up of 10, and its first value came on bar 25 of the example data.
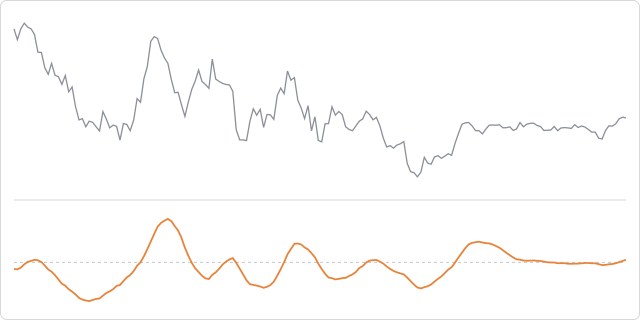
The prices are made up, hourly, and the same on every page, so the chart shows how the indicator behaves, not how a market behaved.
In an algorithm
Section titled “In an algorithm”let previous;
function onIntervalClose() { const value = coppock(14, 10, 11); if (OPEN_POSITIONS_COUNT === 0 && previous !== undefined && value < 0 && value > previous) { openPosition("BUY", { quantity: 10000, stopLossPips: 30, takeProfitPips: 60 }); } previous = value;}