

Pretty Good Oscillator (PGO)
How many average bar sizes the close is from its moving average.
What it measures
Section titled “What it measures”PGO, from Mark Johnson, divides the distance between the close and its simple moving average by an exponential average of the true range of the same length, the measure behind the Average True Range. A reading of 3 means the close is three typical bars above its average.
How traders read it
Section titled “How traders read it”Johnson’s rule buys a close above +3 and exits on a return to zero, and the reverse below −3; the chart draws lines at ±3. It is a breakout signal, not a reversal one.
Formula
Section titled “Formula”PGO = (close − SMA(periods)) / EMA(true range, periods)Johnson’s definition uses an ordinary EMA of the true range; Wilder’s ATR is a slower average and gave smaller swings.
Settings and output
Section titled “Settings and output”Call: pgo(periods)
| Setting | Chart default |
|---|---|
periods: Periods |
14 |
What you get: a number.
Warm-up: with pgo(14), it asks for 14 bars of history and a run-up of 15, and its first value came on bar 29 of the example data.
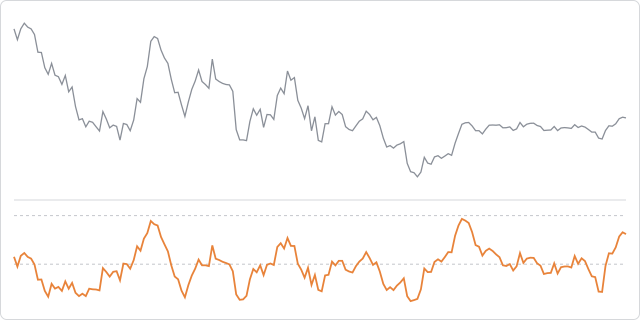
The prices are made up, hourly, and the same on every page, so the chart shows how the indicator behaves, not how a market behaved.
In an algorithm
Section titled “In an algorithm”function onIntervalClose() { const value = pgo(14); if (OPEN_POSITIONS_COUNT === 0 && value > 3) { openPosition("BUY", { quantity: 10000, stopLossPips: 30, takeProfitPips: 60 }); } if (OPEN_POSITIONS_COUNT > 0 && value < 0) { closeAllPositions(); }}