

Commodity Channel Index (CCI)
How far the price has strayed from its average, measured against how far it usually strays.
What it measures
Section titled “What it measures”CCI compares the typical price, (high + low + close) / 3, with its own moving average, and divides by the mean deviation. The constant of 0.015 is Lambert’s, chosen so most values fall between −100 and +100.
How traders read it
Section titled “How traders read it”Traders read above +100 as unusually strong and below −100 as unusually weak. Some trade the move out of those zones, others the move into them as the start of a trend. The last two settings only move the reference lines on the chart.
Formula
Section titled “Formula”typical price = (high + low + close) / 3CCI = (typical price − SMA(typical price)) / (constant × mean deviation of typical price)Settings and output
Section titled “Settings and output”Call: cci(periods, constant, overboughtLine, oversoldLine)
| Setting | Chart default |
|---|---|
periods: Periods |
20 |
constant: Constant |
0.015 |
overboughtLine: Overbought Line |
100 |
oversoldLine: Oversold Line |
-100 |
What you get: a number.
Warm-up: with cci(20, 0.015, 100, -100), it asks for 0 bars of history and a run-up of 20, and its first value came on bar 20 of the example data.
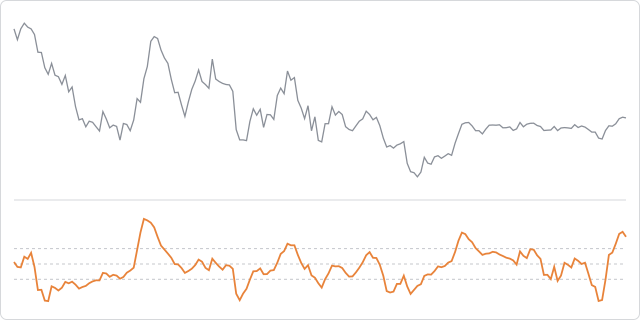
The prices are made up, hourly, and the same on every page, so the chart shows how the indicator behaves, not how a market behaved.
In an algorithm
Section titled “In an algorithm”function onIntervalClose() { const value = cci(20, 0.015); if (OPEN_POSITIONS_COUNT === 0 && value > 100) { openPosition("BUY", { quantity: 10000, stopLossPips: 25, takeProfitPips: 50 }); }}Pass only the first two settings in an algorithm; the lines are for the chart.