

Detrended Price Oscillator (DPO)
Price with the trend removed, so the cycles stand out.
What it measures
Section titled “What it measures”How far a past close sat above or below the moving average. Comparing a close from half a window back with the current average takes the slow trend out and leaves the shorter swings.
How traders read it
Section titled “How traders read it”Traders use it to measure the length of cycles, peak to peak or trough to trough, rather than as a signal on the latest bar: it is drawn shifted back in time, so its right-hand end is always half a window old.
Formula
Section titled “Formula”displacement = floor(periods / 2 + 1)DPO = close(displacement bars ago) − SMA(periods)Both the DPO and the SMA are drawn displacement bars back on the chart.
Settings and output
Section titled “Settings and output”Call: dpo(periods)
| Setting | Chart default |
|---|---|
periods: Periods |
20 |
What you get: a list of 2, in this order: 1. a number (“DPO”); 2. a number (“SMA”).
Warm-up: with dpo(20), it asks for 20 bars of history and a run-up of 1, and its first value came on bar 21 of the example data.
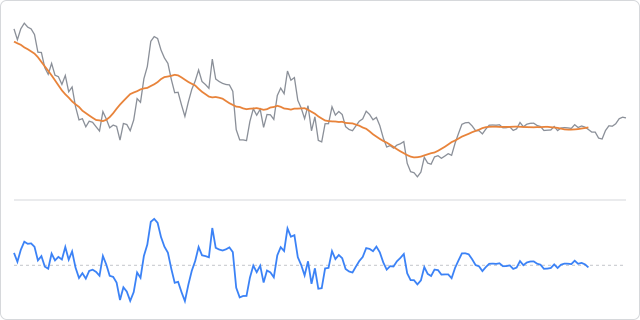
The prices are made up, hourly, and the same on every page, so the chart shows how the indicator behaves, not how a market behaved.
In an algorithm
Section titled “In an algorithm”function onIntervalClose() { const lines = dpo(20); log("DPO", lines[0], "SMA", lines[1]);}It gives [dpo, sma]: the oscillator and the average it was measured against.