

Force Index
The force behind each move: how far the price moved, times how much volume moved it.
What it measures
Section titled “What it measures”Alexander Elder’s Force Index multiplies the change in close by the bar’s volume and smooths the result with an EMA. It is in price times volume, so compare it only with itself. Volume here is the volume the price feed reports for each bar. For forex, brokers usually report the number of price updates in the bar, not an amount traded, so read it as activity rather than money.
How traders read it
Section titled “How traders read it”Traders read a cross of zero as a shift in control, and use it with a trend filter: in an uptrend, a dip below zero is a chance to buy.
Formula
Section titled “Formula”force = (close − previous close) × volumeForce Index = EMA(force, periods)Settings and output
Section titled “Settings and output”Call: forceIndex(periods)
| Setting | Chart default |
|---|---|
periods: Periods |
13 |
What you get: a number.
Warm-up: with forceIndex(13), it asks for 2 bars of history and a run-up of 13, and its first value came on bar 15 of the example data.
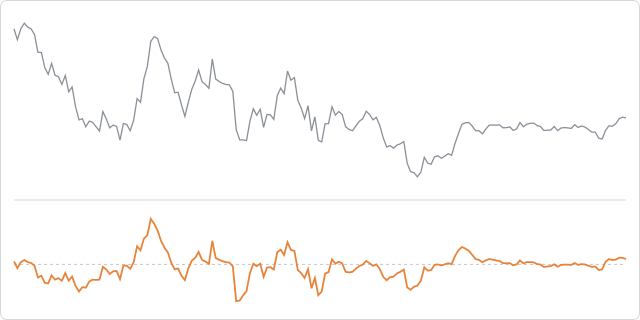
The prices are made up, hourly, and the same on every page, so the chart shows how the indicator behaves, not how a market behaved.
In an algorithm
Section titled “In an algorithm”function onIntervalClose() { if (OPEN_POSITIONS_COUNT === 0 && ema(50) < CLOSE && forceIndex(13) < 0) { openPosition("BUY", { quantity: 10000, stopLossPips: 25, takeProfitPips: 50 }); }}