

Elder Bull/Bear Power
How far buyers pushed the high above the average, and how far sellers pushed the low below it.
What it measures
Section titled “What it measures”Alexander Elder’s Bull Power is the bar’s high minus an EMA of the close; Bear Power is the low minus the same EMA. Both are in price units.
How traders read it
Section titled “How traders read it”Elder used them with a trend filter: in an uptrend, buy when Bear Power is negative but rising; in a downtrend, sell when Bull Power is positive but falling.
Formula
Section titled “Formula”Bull Power = high − EMA(periods)Bear Power = low − EMA(periods)Settings and output
Section titled “Settings and output”Call: elderBBPower(periods)
| Setting | Chart default |
|---|---|
periods: Periods |
13 |
What you get: a list of 2, in this order: 1. a number (“Elder Bull Power”); 2. a number (“Elder Bear Power”).
Warm-up: with elderBBPower(13), it asks for 13 bars of history and a run-up of 26, and its first value came on bar 14 of the example data.
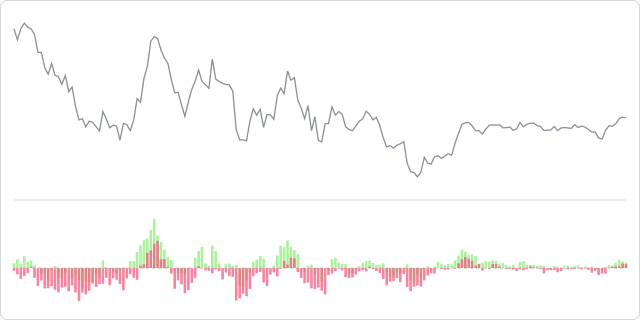
The prices are made up, hourly, and the same on every page, so the chart shows how the indicator behaves, not how a market behaved.
In an algorithm
Section titled “In an algorithm”let previousBear;
function onIntervalClose() { const power = elderBBPower(13); const bear = power[1]; const rising = previousBear !== undefined && bear > previousBear; if (OPEN_POSITIONS_COUNT === 0 && ema(13) > ema(50) && bear < 0 && rising) { openPosition("BUY", { quantity: 10000, stopLossPips: 25, takeProfitPips: 50 }); } previousBear = bear;}