

Gopalakrishnan Range Index (GAPO)
How large the range of the last few bars is, on a logarithmic scale.
What it measures
Section titled “What it measures”The highest high minus the lowest low of the window, put through a logarithm and divided by the logarithm of the window length.
How traders read it
Section titled “How traders read it”Higher values mean a more erratic market. Because it is in price units, the level differs between instruments: compare it with its own history on the same instrument.
Formula
Section titled “Formula”GAPO = log(highest high − lowest low) / log(periods), over the last periods barsFor a currency pair the range is a small fraction of 1, so the logarithm and the value are negative. periods must be at least 2, since the logarithm of 1 is 0, and a window with no range gives no value.
Settings and output
Section titled “Settings and output”Call: gapo(periods)
| Setting | Chart default |
|---|---|
periods: Periods |
10 |
What you get: a number.
Warm-up: with gapo(10), it asks for 10 bars of history and a run-up of 1, and its first value came on bar 11 of the example data.
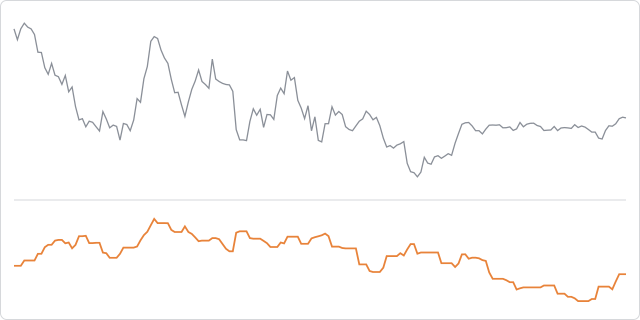
The prices are made up, hourly, and the same on every page, so the chart shows how the indicator behaves, not how a market behaved.
In an algorithm
Section titled “In an algorithm”function onIntervalClose() { log("GAPO", gapo(10));}