

Writing your own indicators
Most indicators are a few lines of arithmetic. This page shows how to write one well.
A custom indicator is a short JavaScript file that Cloud9Trader runs once per bar. It returns a value, which you can draw on any chart and call from an algorithm by its key, like a built-in indicator. To build one step by step, follow Write a custom indicator. Every function and value an indicator can use is listed in Custom indicators.
Most indicators are short
Section titled “Most indicators are short”Each built-in indicator is a file like yours, and you can open its source from the Indicators list. Here is the exponential moving average, as Cloud9Trader runs it:
var exponent;var EMA;
function getRunUpCount(periods) {  return periods * 2;}
function getBufferSize(periods) {  return periods;}
function onStart(periods) {  exponent = 2 / (periods + 1);}
function onIntervalClose(periods) {  if (EMA === undefined) {    EMA = Math.average(prices(periods));  } else {    EMA = (CLOSE - EMA) * exponent + EMA;  }  return EMA;}
The calculation is two lines. The rest tells Cloud9Trader how much history to load, which the next section explains.
How an indicator runs
Section titled “How an indicator runs”- Your settings are checked. The indicator’s settings, such as
periods, are the arguments its functions take, in order.validate,onStartandonIntervalClosemust all list the same ones.validaterejects settings that make no sense by callingerror(). - History is loaded.
getRunUpCountsays how many bars before the start to run the indicator over, so it already has a value on the first bar.getBufferSizesays how many past barsprices()needs to reach. Both default to almost nothing, so an indicator that looks back should set them. - The top-level code runs, then
onStart, once each. Work out anything that depends only on the settings here, such asexponentabove or a series name. onIntervalCloseruns at the close of every bar, first through the run-up bars, then through the bars you asked for. It reads the bar that just closed (OPEN,HIGH,LOW,CLOSE,VOLUME) and returns the indicator’s value.
Each set of settings is its own copy of the indicator, with its own variables, so ema(10) and ema(50) never share an EMA.
Remembering values between bars
Section titled “Remembering values between bars”A variable declared at the top level keeps its value from one bar to the next, as EMA does above. That is how an indicator keeps a running total or the last few values. Declare it with a starting value, such as var values = [];, and fill it in onStart or onIntervalClose. A top-level declaration can also read your parameters, such as var weight = 2 / (periods + 1);. It is worked out once, when the indicator starts and before the first bar, so the bar’s values, such as CLOSE, are not set yet: read those in onIntervalClose.
VALUE holds what your indicator returned for the previous bar, which saves a variable for indicators that build on their last value.
Until an indicator has enough bars, return null. Nothing is drawn for that bar, and an algorithm that calls the indicator gets undefined. With the run-up set high enough, the indicator has a value by the start date, so null only shows during the run-up.
Choosing what to return
Section titled “Choosing what to return”What onIntervalClose returns decides what the chart draws. An algorithm gets only the numbers.
A number: a line on the price
Section titled “A number: a line on the price”function onIntervalClose() { return CLOSE * 1.001;}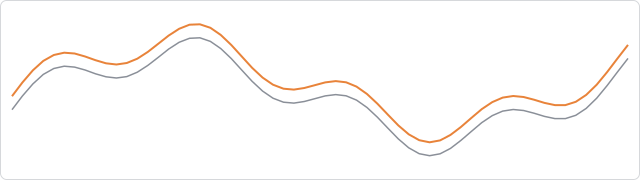
Use this for anything measured in price, such as a moving average or a stop level.
Two numbers: a shaded range
Section titled “Two numbers: a shaded range”function onIntervalClose() { const margin = CLOSE * 0.001; return { name: "Range", value: [CLOSE - margin, CLOSE + margin] };}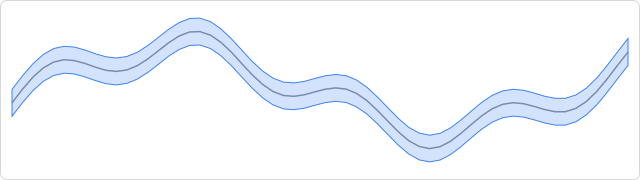
Use this for a channel or an envelope. Return the pair as the value of an object, as here, or inside another array: [[low, high]]. The chart also shades a bare [low, high], or [low, high, middle], when all the items are plain numbers drawn on the price, which is how Bollinger Bands and the envelopes are drawn. Add envelope: false to an item to keep separate lines instead.
overlay: false: a panel of its own
Section titled “overlay: false: a panel of its own”function onIntervalClose(periods) { const closes = prices(periods + 1); return { name: "Momentum", overlay: false, value: closes[0] - closes[periods] };}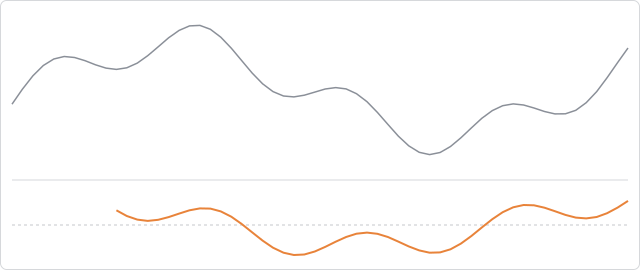
Use this for anything not measured in price, such as an oscillator from 0 to 100 or a change in price. Such an indicator is called a study. getStudyAxisConfig can fix the panel’s scale and add reference lines:
function getStudyAxisConfig() { return { min: 0, max: 100, tickPositions: [0, 20, 80, 100] };}An array: several lines at once
Section titled “An array: several lines at once”function getBufferSize(periods) { return periods;}
function onIntervalClose(periods) { const closes = prices(periods); const mid = Math.mean(closes); const margin = Math.standardDeviation(closes) * 2; return [ [mid - margin, mid + margin], { name: "Middle", dashStyle: "Dash", value: mid }, ];}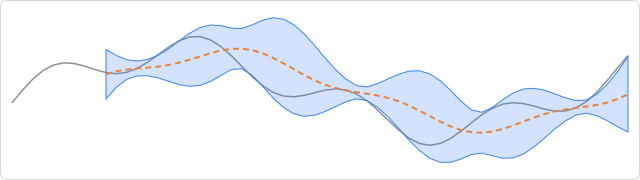
Each item can be any of the shapes above, and each can be an overlay or a study. An algorithm gets an array of the values in the same order: here, the range first, then the middle.
If any item is null, the whole bar has no value. Return null for the whole indicator until every line has a value.
Display settings
Section titled “Display settings”An object’s value is the indicator’s value. Its other properties set how the chart draws it:
name: shown in the chart’s tooltip.overlay:falsedraws the line in its own panel.color,lineWidthanddashStyle, such as"Dash".type:"spline"(the default for a line),"line","area","areaspline"or"column"; for a range,"areasplinerange"(the default),"arearange"or"columnrange".envelope:falsestops the chart shading between the first two of two or three lines.opposite:truegives the line its own scale on the right, so a line with a different range, such as volume, can share a panel.precision: decimal places in the tooltip.
The chart reads these settings from the first bar the indicator returns, so later changes to them are ignored. Set the name once in onStart, as the built-in indicators do.
Building on other indicators
Section titled “Building on other indicators”An indicator can call any other indicator by its key, built-in or your own, as an algorithm does. The Percentage Price Oscillator is built from two exponential moving averages:
function getRunUpCount(fast, slow) {  return slow * 2;}
function getBufferSize(fast, slow) {  return slow;}
function onIntervalClose(fast, slow) {  const fastEMA = ema(fast);  const slowEMA = ema(slow);  return { name: "PPO", overlay: false, value: ((fastEMA - slowEMA) / slowEMA) * 100 };}
The history is shared, and the outermost indicator decides how much is loaded. So the outer indicator’s getRunUpCount and getBufferSize must cover what the inner ones need: here ema(slow) runs over slow * 2 bars, so the PPO asks for the same. If an inner indicator needs more, the extra prices load while the indicator waits, with a warning in the log. In a live session that pause can delay a trade, so ask for enough up front.
An indicator can also read another timeframe’s prices, such as D1.prices.high(5) for the last five daily highs.
Using it in an algorithm
Section titled “Using it in an algorithm”Call it by its key with its settings: myMomentum(10). Like a built-in, each set of settings is calculated once per bar and counts towards the limit of 10 indicators per algorithm. Test it with New Test before you rely on it: a value that is not a number is skipped on a chart, but stops a backtest or a live session. See Write a custom indicator.
Read next
Section titled “Read next”- Custom indicators: every function and value, with the exact rules.
- Write a custom indicator: build, test and use one step by step.
- Indicator SDK: the built-in indicators you can build on.
- Indicator catalogue: how each built-in indicator is computed, with its chart.