

Smoothed Moving Average (SMMA)
The slow, steady average inside RSI, ATR and ADX, available on its own.
What it measures
Section titled “What it measures”The SMMA is an exponential average whose weight on the newest close is 1 / periods, where the EMA’s is 2 / (periods + 1). So it reacts about half as fast as an EMA of the same length: an SMMA of N periods follows an EMA of 2N − 1. It is also called the Running Moving Average (RMA).
How traders read it
Section titled “How traders read it”As with any moving average, a close above it points up and below it down, and crossings are signals. Its slowness suits it to filtering the trend more than timing entries.
Formula
Section titled “Formula”first SMMA = SMA of the first `periods` closesSMMA = (previous SMMA × (periods − 1) + CLOSE) / periodsSettings and output
Section titled “Settings and output”Call: smma(periods)
| Setting | Chart default |
|---|---|
periods: Periods |
14 |
What you get: a number.
Warm-up: with smma(14), it asks for 0 bars of history and a run-up of 56, and its first value came on bar 14 of the example data.
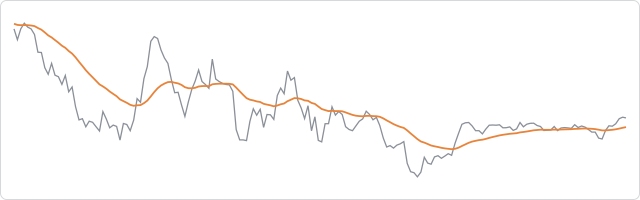
The prices are made up, hourly, and the same on every page, so the chart shows how the indicator behaves, not how a market behaved.
In an algorithm
Section titled “In an algorithm”function onIntervalClose() { const slow = smma(14); if (slow !== null && CLOSE > slow && OPEN_POSITIONS_COUNT === 0) { openPosition("BUY", { quantity: 10000, stopLossPips: 30 }); }}