

Linear Regression
Where the best-fit trend line through the window says the price should be now.
What it measures
Section titled “What it measures”For each bar, Linear Regression fits a straight line through the last periods closes by least squares and takes its value at the newest bar. It is also called the least squares moving average. Because it projects the fitted slope forward, it sits on the price when the price rises or falls by the same amount every bar, where a moving average would trail behind. It overshoots at turns.
How traders read it
Section titled “How traders read it”Like a moving average: a close above it points up and below it down, and its slope is the trend’s direction and pace. Traders also draw bands a number of standard errors either side of it.
Formula
Section titled “Formula”fit CLOSE = a + b × x by least squares over the window, with x = 0 for the oldest closevalue = a + b × (periods − 1)This is TA-Lib’s LINEARREG and TradingView’s ta.linreg with no offset.
Settings and output
Section titled “Settings and output”Call: linearRegression(periods)
| Setting | Chart default |
|---|---|
periods: Periods |
14 |
What you get: a number.
Warm-up: with linearRegression(14), it asks for 14 bars of history and a run-up of 1, and its first value came on bar 15 of the example data.
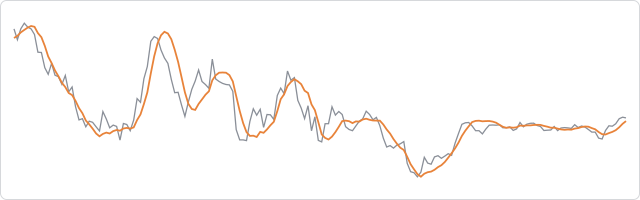
The prices are made up, hourly, and the same on every page, so the chart shows how the indicator behaves, not how a market behaved.
In an algorithm
Section titled “In an algorithm”function onIntervalClose() { const fit = linearRegression(14); if (fit !== null && CLOSE > fit && OPEN_POSITIONS_COUNT === 0) { openPosition("BUY", { quantity: 10000, stopLossPips: 30 }); }}