

Hull Moving Average (HMA)
A moving average built to be smooth and quick at once.
What it measures
Section titled “What it measures”Alan Hull’s average doubles a WMA over half the period and takes away a WMA over the whole period, which projects the trend forward and cancels most of the lag. A WMA of that result over the square root of the period smooths it again.
How traders read it
Section titled “How traders read it”The slope is the signal: turning up is bullish and turning down bearish. Because it reacts quickly it overshoots at turns more than slower averages do.
Formula
Section titled “Formula”raw = 2 × WMA(CLOSE, floor(periods / 2)) − WMA(CLOSE, periods)HMA = WMA(raw, floor(√periods))The lengths are rounded down, as Hull’s formula and TradingView’s ta.hma round them. The period must be at least 4, so that the second smoothing has more than one bar.
Settings and output
Section titled “Settings and output”Call: hullMa(periods)
| Setting | Chart default |
|---|---|
periods: Periods |
9 |
What you get: a number.
Warm-up: with hullMa(9), it asks for 9 bars of history and a run-up of 18, and its first value came on bar 12 of the example data.
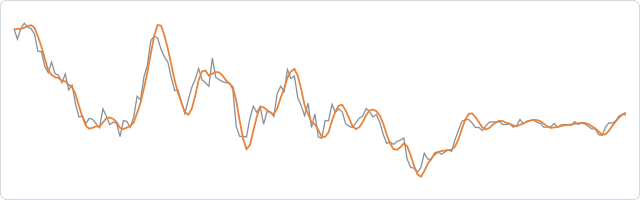
The prices are made up, hourly, and the same on every page, so the chart shows how the indicator behaves, not how a market behaved.
In an algorithm
Section titled “In an algorithm”let previous = null;
function onIntervalClose() { const hull = hullMa(9); if (hull !== null && previous !== null && hull > previous && OPEN_POSITIONS_COUNT === 0) { openPosition("BUY", { quantity: 10000, stopLossPips: 30 }); } previous = hull;}