

Double Exponential Moving Average (DEMA)
A moving average that keeps up with a steady trend.
What it measures
Section titled “What it measures”An EMA trails a trend. An EMA of that EMA trails it twice as far. Taking the second away from twice the first cancels the lag, so on prices rising by the same amount every bar the DEMA sits on the close. Patrick Mulloy published it in 1994. It is not a double smoothing: it is smoother than the price but less smooth than an EMA.
How traders read it
Section titled “How traders read it”Traders use it where an EMA would turn too late: crossings of price, or of a slower average, come sooner. The price of that speed is more false turns in a sideways market.
Formula
Section titled “Formula”EMA1 = EMA(CLOSE, periods)EMA2 = EMA(EMA1, periods)DEMA = 2 × EMA1 − EMA2Each EMA starts from the mean of its first periods values, as TA-Lib’s DEMA does.
Settings and output
Section titled “Settings and output”Call: dema(periods)
| Setting | Chart default |
|---|---|
periods: Periods |
20 |
What you get: a number.
Warm-up: with dema(20), it asks for 0 bars of history and a run-up of 120, and its first value came on bar 39 of the example data.
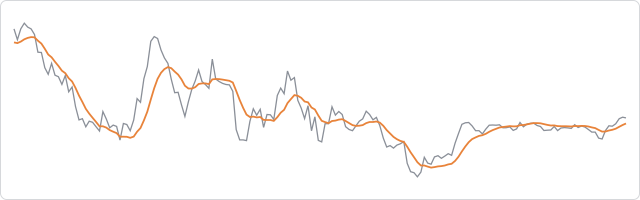
The prices are made up, hourly, and the same on every page, so the chart shows how the indicator behaves, not how a market behaved.
In an algorithm
Section titled “In an algorithm”function onIntervalClose() { const fast = dema(20); if (fast !== null && CLOSE > fast && OPEN_POSITIONS_COUNT === 0) { openPosition("BUY", { quantity: 10000, stopLossPips: 30 }); }}