

Ultimate Oscillator
Buying pressure over three time spans blended into one number from 0 to 100.
What it measures
Section titled “What it measures”For each bar, buying pressure is how far the close is above the lower of the low and the previous close, and the true range is the bar’s range including any gap. The oscillator compares the two over a short, a medium and a long window, and weights the short one most.
How traders read it
Section titled “How traders read it”Traders read above 70 as overbought and below 30 as oversold, and look for divergences: the price making a new low while the oscillator does not.
Formula
Section titled “Formula”buying pressure = close − lowest of (low, previous close)true range = highest of (high, previous close) − lowest of (low, previous close)average(n) = sum of buying pressure over n bars / sum of true range over n barsUO = (4 × average(short) + 2 × average(medium) + average(long)) / 7 × 100Settings and output
Section titled “Settings and output”Call: uo(shortPeriods, mediumPeriods, longPeriods)
| Setting | Chart default |
|---|---|
shortPeriods: Short Periods |
7 |
mediumPeriods: Medium Periods |
14 |
longPeriods: Long Periods |
28 |
What you get: a number.
Warm-up: with uo(7, 14, 28), it asks for 2 bars of history and a run-up of 28, and its first value came on bar 30 of the example data.
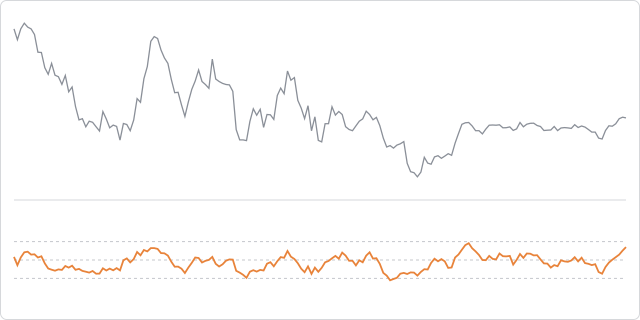
The prices are made up, hourly, and the same on every page, so the chart shows how the indicator behaves, not how a market behaved.
In an algorithm
Section titled “In an algorithm”function onIntervalClose() { if (OPEN_POSITIONS_COUNT === 0 && uo(7, 14, 28) < 30) { openPosition("BUY", { quantity: 10000, stopLossPips: 25, takeProfitPips: 40 }); }}