

Price Momentum Oscillator (PMO)
The one-bar rate of change, smoothed twice so only sustained moves show.
What it measures
Section titled “What it measures”PMO, from DecisionPoint, smooths the one-bar percentage change with one exponential average, multiplies by 10, and smooths it again. With signalEMAPeriods, an EMA of PMO is added as a signal line.
How traders read it
Section titled “How traders read it”Traders read PMO crossing its signal line as a turn and its distance from zero as the strength of the trend. Its levels depend on the instrument’s volatility, so compare them with its own history.
Formula
Section titled “Formula”change = (close / previous close) × 100 − 100PMO = smooth(10 × smooth(change, first), second)signal = EMA(PMO, signalEMAPeriods)smooth is DecisionPoint’s custom smoothing: an exponential average whose weight is 2 / periods, where an ordinary EMA uses 2 / (periods + 1). The signal line is an ordinary EMA. Each average starts from a simple average of its first values. firstEMAPeriods and secondEMAPeriods must be at least 2.
Settings and output
Section titled “Settings and output”Call: pmo(firstEMAPeriods, secondEMAPeriods, signalEMAPeriods)
| Setting | Chart default |
|---|---|
firstEMAPeriods: First EMA Periods |
35 |
secondEMAPeriods: Second EMA Periods |
20 |
signalEMAPeriods: Signal EMA Periods |
10 |
What you get: a list of 2, in this order: 1. a number (“PMO”); 2. a number (“PMO Signal Line”).
Warm-up: with pmo(35, 20, 10), it asks for 0 bars of history and a run-up of 66, and its first value came on bar 64 of the example data.
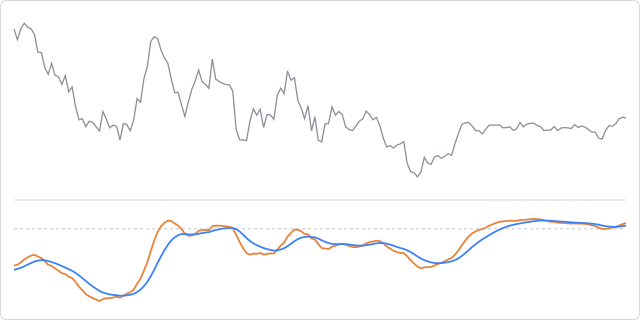
The prices are made up, hourly, and the same on every page, so the chart shows how the indicator behaves, not how a market behaved.
In an algorithm
Section titled “In an algorithm”function onIntervalClose() { const lines = pmo(35, 20, 10); if (OPEN_POSITIONS_COUNT === 0 && lines[0] > lines[1] && lines[0] < 0) { openPosition("BUY", { quantity: 10000, stopLossPips: 30, takeProfitPips: 60 }); }}Without signalEMAPeriods, pmo(35, 20) gives a single number.