

True Strength Index (TSI)
The direction and steadiness of recent price changes, from −100 to +100.
What it measures
Section titled “What it measures”TSI smooths the bar-to-bar change twice with exponential moving averages, and divides by the same smoothing of the absolute change. A steady rise gives a value near +100; choppy moves give values near zero.
How traders read it
Section titled “How traders read it”Traders read crosses of zero and of the signal line, and readings beyond ±25 as strong.
Formula
Section titled “Formula”change = close − previous closeTSI = EMA(EMA(change, first), second) / EMA(EMA(|change|, first), second) × 100signal = EMA(TSI, signalPeriods)Settings and output
Section titled “Settings and output”Call: tsi(firstPeriods, secondPeriods, signalPeriods)
| Setting | Chart default |
|---|---|
firstPeriods: First Periods |
25 |
secondPeriods: Second Periods |
13 |
signalPeriods: Signal Periods |
9 |
What you get: a list of 2, in this order: 1. a number (“tsi”); 2. a number (“tsi Signal”).
Warm-up: with tsi(25, 13, 9), it asks for 2 bars of history and a run-up of 94, and its first value came on bar 47 of the example data.
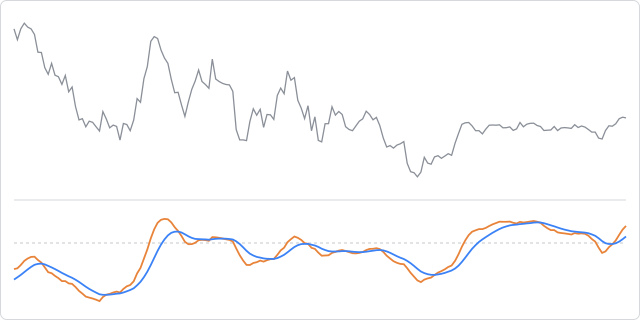
The prices are made up, hourly, and the same on every page, so the chart shows how the indicator behaves, not how a market behaved.
In an algorithm
Section titled “In an algorithm”function onIntervalClose() { const lines = tsi(25, 13, 9); if (OPEN_POSITIONS_COUNT === 0 && lines[0] > lines[1] && lines[0] < -25) { openPosition("BUY", { quantity: 10000, stopLossPips: 25, takeProfitPips: 50 }); }}Without signalPeriods, tsi(25, 13) gives a single number.