

VWAP
The average price paid so far today, with busy bars counting for more.
What it measures
Section titled “What it measures”VWAP adds up each bar’s typical price times its volume since the start of the day, and divides by the volume. The day is the UTC day: the sums start again with the first bar that opens at or after 00:00 UTC, which suits markets that trade around the clock.
On FX the volume is the broker’s tick volume, the number of price changes in the bar, not the amount traded. Tick volume tracks real activity closely enough to weight by, but it is a proxy.
How traders read it
Section titled “How traders read it”Price above VWAP means buyers have paid up through the day, and below means sellers are in control. Intraday traders buy pullbacks to VWAP in an uptrend and fade moves away from it in a range. Larger traders use it as a benchmark for their fills.
Formula
Section titled “Formula”typical price = (HIGH + LOW + CLOSE) / 3VWAP = Σ(typical price × VOLUME) / Σ VOLUME, over the bars of the day so farVWAP needs the whole day, so it has no value before the first 00:00 UTC in the data. On minute charts the start of a chart can be blank until then. It is an intraday indicator, so it refuses daily bars.
Settings and output
Section titled “Settings and output”Call: vwap()
No settings.
What you get: a number.
Warm-up: with no settings, it asks for 0 bars of history and a run-up of 25, and its first value came on bar 25 of the example data.
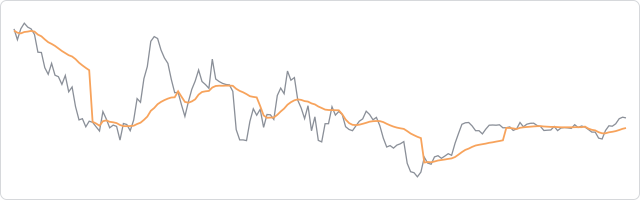
The prices are made up, hourly, and the same on every page, so the chart shows how the indicator behaves, not how a market behaved.
In an algorithm
Section titled “In an algorithm”function onIntervalClose() { const average = vwap(); if (average !== null && CLOSE > average && OPEN_POSITIONS_COUNT === 0) { openPosition("BUY", { quantity: 10000, stopLossPips: 30 }); }}