

Mass Index
Whether the bars are getting wider, summed over a window.
What it measures
Section titled “What it measures”The ratio of an EMA of bar ranges to an EMA of that EMA, added up over summationPeriods bars. It rises when ranges widen faster than their average.
How traders read it
Section titled “How traders read it”The classic reading is a “reversal bulge”: the index rising above 27 and then falling back below 26.5 suggests the trend may turn. It does not say in which direction, so traders pair it with a trend indicator.
Formula
Section titled “Formula”range = high − lowsingle = EMA(range, emaPeriods)double = EMA(single, emaPeriods)Mass Index = Σ (single / double), over the last summationPeriods barsSettings and output
Section titled “Settings and output”Call: massIndex(emaPeriods, summationPeriods)
| Setting | Chart default |
|---|---|
emaPeriods: EMA Periods |
9 |
summationPeriods: Summation Periods |
25 |
What you get: a number.
Warm-up: with massIndex(9, 25), it asks for 0 bars of history and a run-up of 43, and its first value came on bar 41 of the example data.
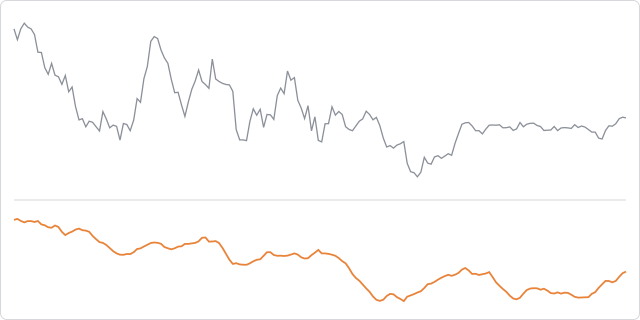
The prices are made up, hourly, and the same on every page, so the chart shows how the indicator behaves, not how a market behaved.
In an algorithm
Section titled “In an algorithm”let wasAbove27 = false;
function onIntervalClose() { const mass = massIndex(9, 25); if (mass > 27) { wasAbove27 = true; } else if (wasAbove27 && mass < 26.5) { log("Reversal bulge completed"); wasAbove27 = false; }}