

Woodie's Pivot Points
Five levels for the day, with the pivot pulled toward yesterday’s close.
What it measures
Section titled “What it measures”Woodie’s pivot weights the previous day’s close twice, so it sits nearer to where the day ended than the floor pivot does. Two resistance and two support levels are set from it as for the floor pivots.
How traders read it
Section titled “How traders read it”As the floor pivots: the levels are places where price may pause or turn during the day, and price above the pivot is read as strength. It is meant for intraday timeframes.
Formula
Section titled “Formula”pivot = (high + low + 2 × close) / 4, of the previous dayR1 = 2 × pivot − low S1 = 2 × pivot − highR2 = pivot + (high − low) S2 = pivot − (high − low)Some charting packages weight the current day’s open instead of the previous close. Cloud9Trader uses the previous close, which needs nothing from the day in progress.
Days are UTC and follow Daily Pivot Points: on a Sunday the levels come from Friday’s bar, and on a Monday from Friday’s and Sunday’s high and low together with Sunday’s close. The levels change when the UTC day changes.
Settings and output
Section titled “Settings and output”Call: woodiePivot()
No settings.
What you get: a list of 5, in this order: 1. a number (“R2”); 2. a number (“R1”); 3. a number (“woodiePivot”); 4. a number (“S1”); 5. a number (“S2”).
Warm-up: with no settings, it asks for 3 bars of history and a run-up of 1, and its first value came on bar 24 of the example data.
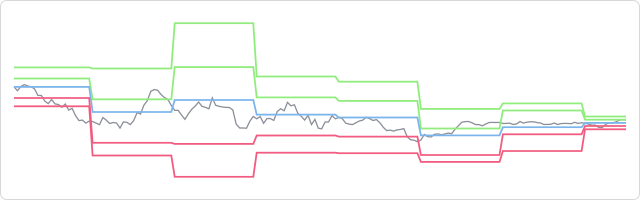
The prices are made up, hourly, and the same on every page, so the chart shows how the indicator behaves, not how a market behaved.
In an algorithm
Section titled “In an algorithm”function onIntervalClose() { const levels = woodiePivot(); if (levels !== null && CLOSE > levels[2] && OPEN_POSITIONS_COUNT === 0) { openPosition("BUY", { quantity: 10000, stopLossPips: 30 }); }}