

Price Channels
The range of the last few bars, drawn as a channel.
What it measures
Section titled “What it measures”The upper line is the highest high of the last periods bars and the lower line the lowest low. The dashed middle is halfway between.
How traders read it
Section titled “How traders read it”Traders read a close at a new channel high as a breakout, the idea behind the classic “Donchian” breakout systems. The channel is flat while the price stays inside it and steps when a new extreme is set.
Formula
Section titled “Formula”upper = highest high of the last periods barslower = lowest low of the last periods barsmiddle = (upper + lower) / 2The window includes the bar that just closed, so its high can equal the upper line but never exceed it. Breakout rules usually compare against the channel from the bar before.
Settings and output
Section titled “Settings and output”Call: priceChannels(periods)
| Setting | Chart default |
|---|---|
periods: Periods |
20 |
What you get: a list of 3, in this order: 1. a number; 2. a number; 3. a number.
Warm-up: with priceChannels(20), it asks for 20 bars of history and a run-up of 1, and its first value came on bar 21 of the example data.
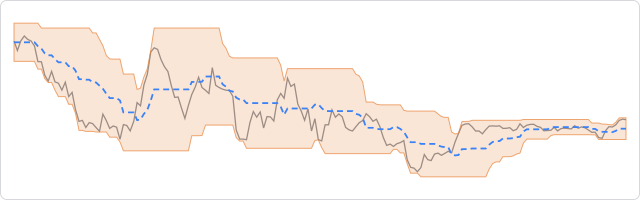
The prices are made up, hourly, and the same on every page, so the chart shows how the indicator behaves, not how a market behaved.
In an algorithm
Section titled “In an algorithm”let previousUpper;
function onIntervalClose() { const channel = priceChannels(20); if (previousUpper !== undefined && CLOSE > previousUpper && OPEN_POSITIONS_COUNT === 0) { openPosition("BUY", { quantity: 10000, stopLoss: channel[2] }); } previousUpper = channel[1];}