

Vortex Indicator
Two lines that measure how far each bar reaches beyond the bar before it, up and down.
What it measures
Section titled “What it measures”VI+ adds up how far each bar’s high reached above the previous bar’s low; VI− adds up how far each low reached below the previous high. Both are divided by the true range over the same bars.
How traders read it
Section titled “How traders read it”Traders read VI+ crossing above VI− as the start of an uptrend and the reverse as a downtrend. Values around 1.1 and 0.9, marked on the chart, are often used as the levels that confirm a cross.
Formula
Section titled “Formula”VI+ = Σ |high − previous low| / Σ true range, over the last periods barsVI− = Σ |low − previous high| / Σ true rangetrue range = the largest of high − low, |high − previous close|, |low − previous close|Settings and output
Section titled “Settings and output”Call: vtx(periods)
| Setting | Chart default |
|---|---|
periods: Periods |
14 |
What you get: a list of 2, in this order: 1. a number (“vtx Negative”); 2. a number (“vtx Positive”).
Warm-up: with vtx(14), it asks for 2 bars of history and a run-up of 14, and its first value came on bar 16 of the example data.
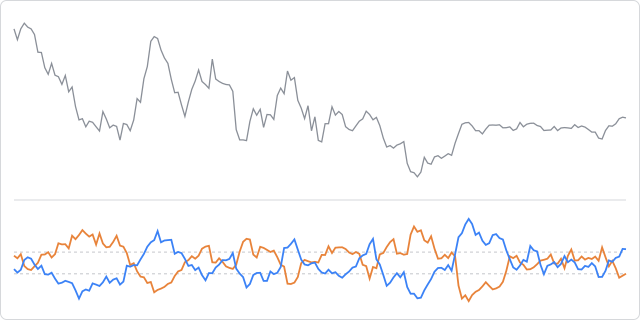
The prices are made up, hourly, and the same on every page, so the chart shows how the indicator behaves, not how a market behaved.
In an algorithm
Section titled “In an algorithm”function onIntervalClose() { const lines = vtx(14); const minus = lines[0]; const plus = lines[1]; if (plus > minus && plus > 1.1) { log("VI+ above VI− and above 1.1"); }}Note the order: VI− first, then VI+.