

Ichimoku Cloud
A whole trading view in one indicator: two midpoint lines, a cloud projected ahead, and a lagging line.
What it measures
Section titled “What it measures”Each line is the midpoint of the range over a window. The two leading spans are drawn ahead of the price, and the space between them is the cloud. The lagging span is today’s close drawn back in time.
How traders read it
Section titled “How traders read it”Traders read price above the cloud as an uptrend and below it as a downtrend, a thick cloud as strong support or resistance, and the conversion line crossing the base line as a change in momentum. It works best on markets that trend; in a range the lines tangle.
Formula
Section titled “Formula”conversion = (highest high + lowest low of the last conversionLinePeriods bars) / 2base = (highest high + lowest low of the last baseLinePeriods bars) / 2spanA = (conversion + base) / 2, drawn baseLinePeriods bars aheadspanB = (highest high + lowest low of the last leadingSpanPeriods bars) / 2, drawn baseLinePeriods bars aheadlagging = close, drawn laggingSpanPeriods bars backThe cloud is shaded green where span A is above span B and red where it is below.
Settings and output
Section titled “Settings and output”Call: ichimokuCloud(conversionLinePeriods, baseLinePeriods, leadingSpanPeriods, laggingSpanPeriods)
| Setting | Chart default |
|---|---|
conversionLinePeriods: Tenkan-sen (Conversion Line) Periods |
9 |
baseLinePeriods: Kijun-sen (Base Line) Periods |
26 |
leadingSpanPeriods: Senkou Span B (Leading Span B) Periods |
52 |
laggingSpanPeriods: Chikou Span (Lagging Span) Periods |
26 |
What you get: a list of 7, in this order: 1. a number (“Ichimoku Tenkan-sen”); 2. a number (“Ichimoku Kijun-sen”); 3. a number (“Ichimoku Senkou Span A”); 4. a number (“Ichimoku Senkou Span B”); 5. a number (“Ichimoku Chikou Span”); 6. a [low, high] pair; 7. a [low, high] pair.
Warm-up: with ichimokuCloud(9, 26, 52, 26), it asks for 52 bars of history and a run-up of 1, and its first value came on bar 53 of the example data.
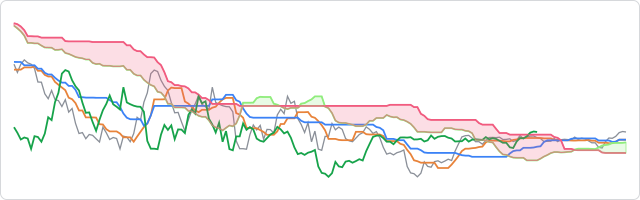
The prices are made up, hourly, and the same on every page, so the chart shows how the indicator behaves, not how a market behaved.
In an algorithm
Section titled “In an algorithm”function onIntervalClose() { const lines = ichimokuCloud(9, 26, 52, 26); const conversion = Number(lines[0]); const base = Number(lines[1]); const spanA = Number(lines[2]); const spanB = Number(lines[3]); if (conversion > base && CLOSE > spanA && CLOSE > spanB) { log("Conversion above base, close above both spans"); }}An algorithm gets the spans for the bar that just closed, not the values drawn ahead of it on the chart.