

Camarilla Pivot Points
Eight tight levels around yesterday’s close.
What it measures
Section titled “What it measures”Camarilla levels are set around the previous day’s close, at a twelfth, a sixth, a quarter and a half of its range, each scaled by 1.1. They sit much closer to price than floor pivots, so price reaches them more often.
How traders read it
Section titled “How traders read it”The usual reading is to fade a move to R3 or S3, expecting price to come back toward the close, and to follow a break through R4 or S4 as the start of a trend. It is meant for intraday timeframes.
Formula
Section titled “Formula”R4 = close + (high − low) × 1.1 / 2 S4 = close − (high − low) × 1.1 / 2 (of the previous day)R3 = close + (high − low) × 1.1 / 4 S3 = close − (high − low) × 1.1 / 4R2 = close + (high − low) × 1.1 / 6 S2 = close − (high − low) × 1.1 / 6R1 = close + (high − low) × 1.1 / 12 S1 = close − (high − low) × 1.1 / 12There is no pivot line: the levels are centred on the previous close.
Days are UTC and follow Daily Pivot Points: on a Sunday the levels come from Friday’s bar, and on a Monday from Friday’s and Sunday’s high and low together with Sunday’s close. The levels change when the UTC day changes.
Settings and output
Section titled “Settings and output”Call: camarillaPivot()
No settings.
What you get: a list of 8, in this order: 1. a number (“R4”); 2. a number (“R3”); 3. a number (“R2”); 4. a number (“R1”); 5. a number (“S1”); 6. a number (“S2”); 7. a number (“S3”); 8. a number (“S4”).
Warm-up: with no settings, it asks for 3 bars of history and a run-up of 1, and its first value came on bar 24 of the example data.
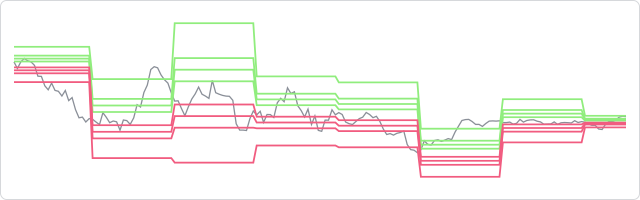
The prices are made up, hourly, and the same on every page, so the chart shows how the indicator behaves, not how a market behaved.
In an algorithm
Section titled “In an algorithm”function onIntervalClose() { const levels = camarillaPivot(); const r3 = levels !== null ? levels[1] : null; if (r3 !== null && CLOSE > r3 && OPEN_POSITIONS_COUNT === 0) { openPosition("SELL", { quantity: 10000, stopLossPips: 30 }); }}