

Fisher Transform
The price’s place in its recent range, stretched so that turns show as sharp peaks.
What it measures
Section titled “What it measures”The Fisher Transform, from John Ehlers, takes the bar’s midpoint, (high + low) / 2, scales its place in the recent range to between −1 and +1, smooths it, and applies the Fisher transform, which pulls values near the edges far out. The signal line is the previous bar’s value.
How traders read it
Section titled “How traders read it”Traders read a sharp peak and a cross of the signal line as a likely turn. Extreme values are common, so the turn matters more than the level.
Formula
Section titled “Formula”midpoint = (high + low) / 2raw = 2 × (midpoint − lowest midpoint) / (highest midpoint − lowest midpoint) − 1 over periods barssmoothed = EMA(raw, 5), held between −0.999 and +0.999Fisher = EMA(ln((1 + smoothed) / (1 − smoothed)), 3)signal = Fisher one bar agoThe smoothing lengths, 5 and 3, are fixed: they are Ehlers’ 0.33 and 0.5 weights. Holding the smoothed value inside ±0.999, as Ehlers’ own code does, keeps the logarithm finite when the price sits at the edge of its range. A window where the price does not move gives a raw value of 0.
Settings and output
Section titled “Settings and output”Call: fisherTransform(periods)
| Setting | Chart default |
|---|---|
periods: Periods |
14 |
What you get: a list of 2, in this order: 1. a number (“Fisher Transform”); 2. a number (“Fisher Transform Signal”).
Warm-up: with fisherTransform(14), it asks for 0 bars of history and a run-up of 23, and its first value came on bar 21 of the example data.
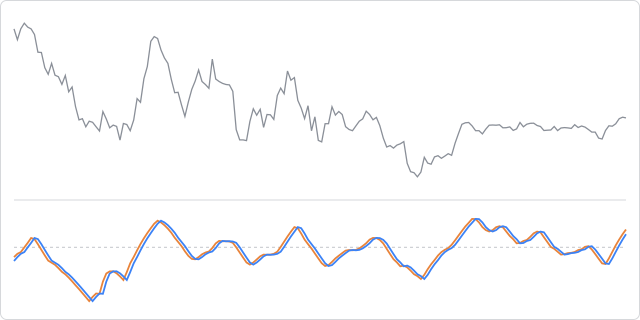
The prices are made up, hourly, and the same on every page, so the chart shows how the indicator behaves, not how a market behaved.
In an algorithm
Section titled “In an algorithm”function onIntervalClose() { const lines = fisherTransform(14); const fisher = lines[0]; const signal = lines[1]; if (OPEN_POSITIONS_COUNT === 0 && fisher > signal && signal < -1.5) { openPosition("BUY", { quantity: 10000, stopLossPips: 25, takeProfitPips: 40 }); }}