

Center of Gravity Oscillator (COG)
Where the weight of the recent closes lies within the window.
What it measures
Section titled “What it measures”John Ehlers’ Center of Gravity weights each close in the window by its age, the newest by 1 and the oldest by periods, and divides by the plain sum, giving a negative number whose level depends on periods and which moves as recent prices rise or fall against older ones. With signalPeriods, an EMA of it is added as a signal line.
How traders read it
Section titled “How traders read it”Traders read crosses of the signal line as turns. Only the movement matters, not the level.
Formula
Section titled “Formula”COG = −Σ close(i) × (i + 1) / Σ close(i) i = 0 for the bar that just closedsignal = EMA(COG, signalPeriods)Settings and output
Section titled “Settings and output”Call: cog(periods, signalPeriods)
| Setting | Chart default |
|---|---|
periods: Periods |
10 |
signalPeriods: Signal Periods |
9 |
What you get: a list of 2, in this order: 1. a number; 2. a number (“cog Signal”).
Warm-up: with cog(10, 9), it asks for 10 bars of history and a run-up of 9, and its first value came on bar 19 of the example data.
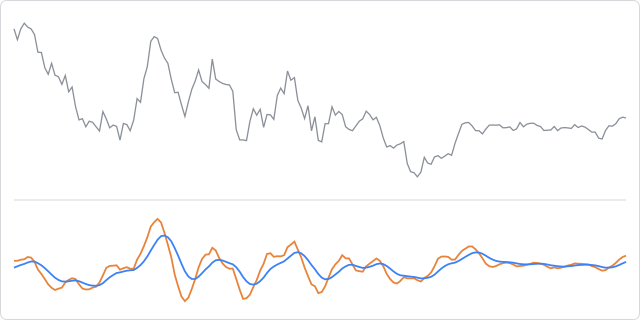
The prices are made up, hourly, and the same on every page, so the chart shows how the indicator behaves, not how a market behaved.
In an algorithm
Section titled “In an algorithm”function onIntervalClose() { const lines = cog(10, 9); if (OPEN_POSITIONS_COUNT === 0 && lines[0] > lines[1]) { openPosition("BUY", { quantity: 10000, stopLossPips: 25, takeProfitPips: 40 }); }}It always returns a list: [COG], or [COG, signal] with signalPeriods. The line rises with the price, so this sample buys when it is above its signal.