

Awesome Oscillator (AO)
A MACD-like histogram built from bar midpoints and simple averages.
What it measures
Section titled “What it measures”The Awesome Oscillator compares a 5-bar simple average of each bar’s midpoint with a 34-bar one. Above zero, the recent midpoints are higher than the longer run of them. Bill Williams fixed the lengths at 5 and 34; here they are settings with those defaults. The value is in pips.
How traders read it
Section titled “How traders read it”Crossing zero is the plainest signal. Williams also described a “saucer”, three columns on one side of zero where the middle one is shortest, and “twin peaks”, two peaks on the same side of zero with the second nearer to it, as signs a move is turning.
Formula
Section titled “Formula”median = (HIGH + LOW) / 2AO = (SMA(median, fastPeriods) − SMA(median, slowPeriods)) / PIP_SIZESettings and output
Section titled “Settings and output”Call: awesomeOscillator(fastPeriods, slowPeriods)
| Setting | Chart default |
|---|---|
fastPeriods: Fast Periods |
5 |
slowPeriods: Slow Periods |
34 |
What you get: a number.
Warm-up: with awesomeOscillator(5, 34), it asks for 0 bars of history and a run-up of 34, and its first value came on bar 34 of the example data.
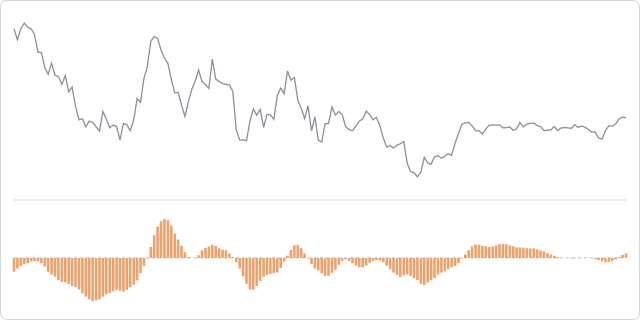
The prices are made up, hourly, and the same on every page, so the chart shows how the indicator behaves, not how a market behaved.
In an algorithm
Section titled “In an algorithm”let previous = null;
function onIntervalClose() { const ao = awesomeOscillator(5, 34); if (ao !== null && previous !== null && previous <= 0 && ao > 0 && OPEN_POSITIONS_COUNT === 0) { openPosition("BUY", { quantity: 10000, stopLossPips: 30 }); } previous = ao;}