

MACD Histogram
MACD minus its signal line, on its own, as columns.
What it measures
Section titled “What it measures”The same histogram as the third value of MACD with a signal line. It is above zero while MACD is above its signal line.
How traders read it
Section titled “How traders read it”Traders watch it cross zero, which is MACD crossing its signal, and its columns shrinking, which shows momentum fading before the cross.
Formula
Section titled “Formula”histogram = MACD(fast, slow) − EMA(MACD, signalEMAPeriods)Settings and output
Section titled “Settings and output”Call: macdHistogram(fastEMAPeriods, slowEMAPeriods, signalEMAPeriods)
| Setting | Chart default |
|---|---|
fastEMAPeriods: Fast EMA Periods |
12 |
slowEMAPeriods: Slow EMA Periods |
26 |
signalEMAPeriods: Signal EMA Periods |
9 |
What you get: a number.
Warm-up: with macdHistogram(12, 26, 9), it asks for 26 bars of history and a run-up of 61, and its first value came on bar 35 of the example data.
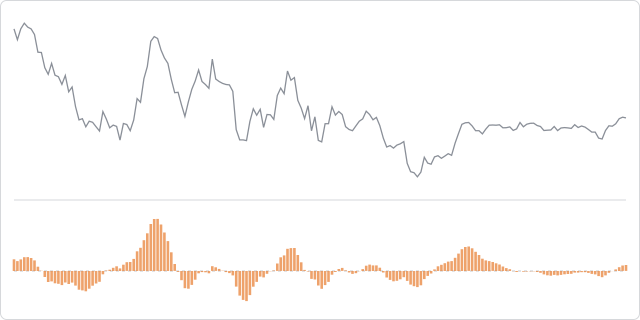
The prices are made up, hourly, and the same on every page, so the chart shows how the indicator behaves, not how a market behaved.
In an algorithm
Section titled “In an algorithm”let previous;
function onIntervalClose() { const value = macdHistogram(12, 26, 9); if (OPEN_POSITIONS_COUNT === 0 && previous !== undefined && previous < 0 && value > 0) { openPosition("BUY", { quantity: 10000, stopLossPips: 25, takeProfitPips: 50 }); } previous = value;}