

Percentage Volume Oscillator (PVO)
Meant to show whether volume is rising or falling against its own average.
What it measures
Section titled “What it measures”PVO applies the Percentage Price Oscillator to volume: a fast EMA of volume against a slow one, as a percentage. With signalEMAPeriods, it adds a signal line and histogram.
How traders read it
Section titled “How traders read it”Traders use rising PVO to confirm a breakout and falling PVO to warn that a move is running out of participation.
Formula
Section titled “Formula”PVO = (EMA(volume, fast) − EMA(volume, slow)) / EMA(volume, slow) × 100signal = EMA(PVO, signalEMAPeriods)histogram = PVO − signalSettings and output
Section titled “Settings and output”Call: pvo(fastEMAPeriods, slowEMAPeriods, signalEMAPeriods)
| Setting | Chart default |
|---|---|
fastEMAPeriods: Fast EMA Periods |
12 |
slowEMAPeriods: Slow EMA Periods |
26 |
signalEMAPeriods: Signal EMA Periods |
9 |
What you get: a list of 3, in this order: 1. a number (“Price Volume Oscillator”); 2. a number (“Price Volume Oscillator Signal”); 3. a number (“Price Volume Oscillator Histogram”).
Warm-up: with pvo(12, 26, 9), it asks for 0 bars of history and a run-up of 61, and its first value came on bar 34 of the example data.
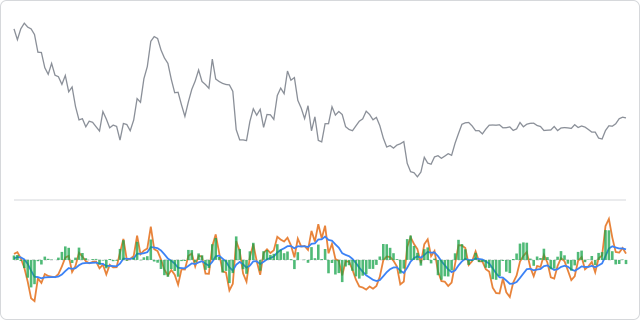
The prices are made up, hourly, and the same on every page, so the chart shows how the indicator behaves, not how a market behaved.
In an algorithm
Section titled “In an algorithm”function onIntervalClose() { const lines = pvo(12, 26, 9); log("PVO", lines[0], "signal", lines[1], "histogram", lines[2]);}With a signal, the order is PVO, signal, histogram: the reverse of the PPO’s order. Without signalEMAPeriods, pvo(12, 26) gives a single number.