

Chaikin Oscillator
The momentum of the Accumulation Distribution Line.
What it measures
Section titled “What it measures”The Accumulation Distribution Line adds up each bar’s volume, weighted by where the close fell in the bar’s range. Marc Chaikin’s oscillator takes a 3-bar EMA of that line less a 10-bar one, as MACD does with price, so it shows whether accumulation or distribution is speeding up. The line’s level depends on where it was started, but the oscillator does not.
How traders read it
Section titled “How traders read it”Crossing above zero says buying pressure is building, and below zero selling pressure. A divergence from price, such as a new price high without a new oscillator high, warns of a turn. On FX the volume is the broker’s tick volume, a count of price changes, so read it as activity rather than traded amount.
Formula
Section titled “Formula”money flow volume = ((CLOSE − LOW) − (HIGH − CLOSE)) / (HIGH − LOW) × VOLUME (0 if HIGH = LOW)ADL = running total of money flow volumeChaikin = EMA(ADL, fastPeriods) − EMA(ADL, slowPeriods)Each EMA starts from the mean of its first values.
Settings and output
Section titled “Settings and output”Call: chaikinOscillator(fastPeriods, slowPeriods)
| Setting | Chart default |
|---|---|
fastPeriods: Fast EMA Periods |
3 |
slowPeriods: Slow EMA Periods |
10 |
What you get: a number.
Warm-up: with chaikinOscillator(3, 10), it asks for 0 bars of history and a run-up of 40, and its first value came on bar 10 of the example data.
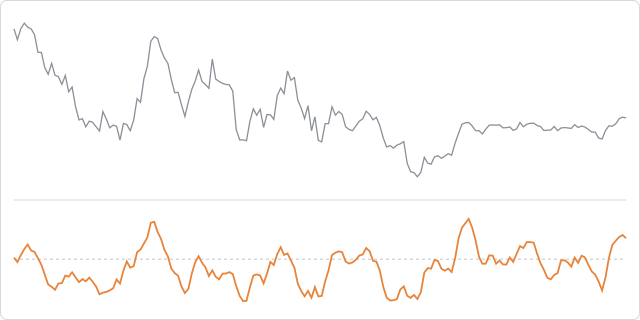
The prices are made up, hourly, and the same on every page, so the chart shows how the indicator behaves, not how a market behaved.
In an algorithm
Section titled “In an algorithm”function onIntervalClose() { const pressure = chaikinOscillator(3, 10); if (pressure !== null && pressure > 0 && OPEN_POSITIONS_COUNT === 0) { openPosition("BUY", { quantity: 10000, stopLossPips: 30 }); }}