

Aroon
Two lines that say how long ago the high and the low of the window were set.
What it measures
Section titled “What it measures”Aroon Up is 100 when the highest high of the last periods + 1 bars is on the latest bar, and falls toward 0 the longer ago it was. Aroon Down does the same for the lowest low.
How traders read it
Section titled “How traders read it”Traders read Aroon Up near 100 with Aroon Down near 0 as a fresh uptrend, the reverse as a downtrend, and both low as a range. The lines crossing is read as a possible change of trend.
Formula
Section titled “Formula”Aroon Up = (periods − bars since the highest high) / periods × 100Aroon Down = (periods − bars since the lowest low) / periods × 100The window is the latest bar and the periods bars before it, so a high on the latest bar gives 100 and a high periods bars ago gives 0. When two bars share the extreme, the more recent one counts.
Settings and output
Section titled “Settings and output”Call: aroon(periods)
| Setting | Chart default |
|---|---|
periods: Periods |
25 |
What you get: a list of 2, in this order: 1. a number (“Aroon Up”); 2. a number (“Aroon Down”).
Warm-up: with aroon(25), it asks for 26 bars of history and a run-up of 1, and its first value came on bar 27 of the example data.
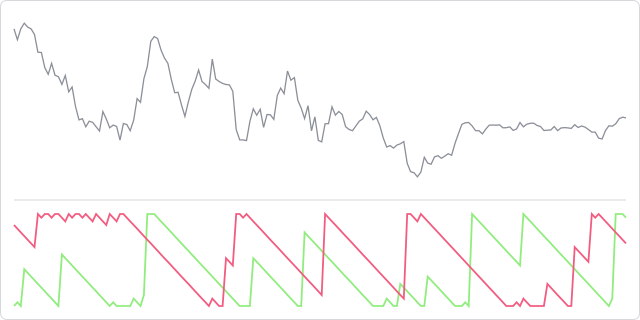
The prices are made up, hourly, and the same on every page, so the chart shows how the indicator behaves, not how a market behaved.
In an algorithm
Section titled “In an algorithm”function onIntervalClose() { const lines = aroon(25); const up = lines[0]; const down = lines[1]; if (up > 70 && down < 30) { log("Recent highs, no recent lows"); }}